Mark Ingham's insights into JSE listed results being released 11 to 27th September 2017 -
Included in this roundup:
- 11 September - AVI
- 27 September - Capitec
AVI - 11 September 2017
“A flavourful result” - tweet about it
AVI, the food products and consumer goods group, reports annual results for the year ended 30 June 2017 on Monday, 11 September. It’ll be a solid result yet again with earnings per share of 505 cents, up by 9%. All operations are largely performing well. Assuming a final dividend of 241 cents, the full year dividend could be 403 cents versus 370 cents in 2016.
Last year, in a note (“Divergent Paths”, 28 July 2016), I compared AVI and Tiger Brands as an investment case and concluded that I would continue to favour AVI in preference to Tiger Brands.
Tiger Brands was R390 at that time and I recommended a Trading Sell with a fair value of R350. Today, the stock is R370, having initially moved enthusiastically to a high of R429 in March before tumbling back.
AVI, was R90 at the time of that note and I held fair value at R92 with a Trading Buy. The stock has been relatively steady and at a current price of over R97 is 8% higher than then.
I observed that whilst Tiger Brands was pricing in a benefit of the doubt premium, given the new CEO, that would not change things much short term and that Tiger would end the year to September flat at best – which indeed was the case. The half-year results too were tepid and the strategic review announced then had a five-year horizon to achieve certain objectives.
For Tiger, earnings have been elusive for some years. In the five years to September 2016, compound growth in operating profit is 0% and even if I remove the effect of Dangote Flour Mills in Nigeria, compound growth has been 6%, roughly matching inflation. Adjusted EPS has also grown at 6% over five years whilst dividends have grown at 6%.
AVI grew operating profit and EPS by a 13,5% compound rate over five years. Dividend per share has grown at a 24% compound rate, excluding special dividends.
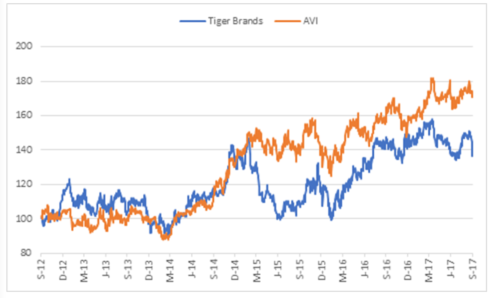
The share price of Tiger Brands has underperformed AVI significantly with the performance gap matching the relative earnings performance.
Tiger Brands and AVI based to 100 over 5 years

History is no predicator of the future but from my knowledge of these companies over many years, I don’t see the performance gap narrowing significantly in the near term. Moreover, the mix of assets within AVI is superior to Tiger, with a degree of resilience, and the management track record speaks for itself.
Product innovation, brand extension, market positioning, and affordable luxury have been important features of AVI’s resilience and its continuing appeal and growth. It seems to get the balance right. There is a range of offerings in food & beverage, fish products, personal care, footwear & apparel with a powerful but affordable non-commodity appeal.
Tiger Brands is on a forward PE ratio of 16,5x with the gross dividend yield at 3,0%. AVI is on a PE ratio of 19,2x but with the lower dividend cover and better cash generation provides a higher gross dividend yield of 4,2%. Moreover, three-year compound growth in earnings is likely to be higher than at Tiger.
Trading Buy and Portfolio Buy maintained on AVI.
Capitec - 27 September 2017
“Outgunning the big four”
Seemingly everybody’s favourite bank reports interim results for the six months ended 31 August 2017 on Wednesday, 27 September. That’s just over a couple of weeks away but in the meantime, ahead of the actual result, it is useful to reflect on what this business has achieved and whether it still offers value for new money.
Judging by the voluntary trading statement, earnings per share at the mid-point will be up by 16,5% to 1767 cents. My own forecast is for annual earnings to be up by 16,3% to 3817 cents so the first six months shows Capitec is on track for that number to be achieved.
It is likely that an interim dividend of 524 cents could be declared, up from 450 cents.
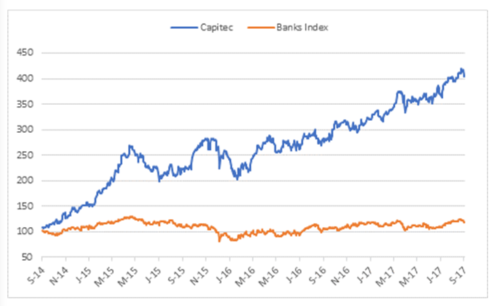
Whilst earnings growth has slowed in recent years, the relative earnings outperformance of Capitec against the big four banks has been maintained or increased.
Capitec is expensive but, historically, this is for good reason. On my adjusted earnings model, I have three-year compound growth in earnings of 15,6%. At a share price of R866, the PEG ratio is 1,8x, which is 20% higher than for average of the big four banks.
The rolling exit PE ratio is 24,3x, compared with less than 10x for the big four. The Capitec forward dividend yield of 1,7% is well below the 6,2% average of the big four. My three-year compound earnings growth estimate of 15,6% is well above the 6,6% average of the forecasts for the big four.
For now, Capitec is a growth company with a dividend cover of 2,6x, or retaining 60% of after-tax profits for reinvestment. This is higher than the big four.
Capitec and Banks Index based to 100 over 3 years

In the very low-income bracket, Capitec has a 25% market share whilst in the mid-income bracket the market share is 11%. As the company brings in previously unbanked customers and offers an attractive alternative to the big four, so in turn has the client base grown significantly.
But the market place is increasingly stressed. Data collated by Capitec, adjusted for inflation, indicates lower cash inflows across all income categories. Of performing customers, cash availability has dwindled whilst the proportion with no inflow has risen sharply. Credit applications are up but acceptance rates have declined sharply.
I expect transaction fee income to increase again and thus reduced reliance on credit. In the previous year, transaction fee income covered 72% of operating expenses. The aim is to get to 100% by 2020, assisted by encouraging more customers to use self-help and cost-effective technology solutions. As an example, the cost of transacting in a branch is R5 compared to R1,50 for self-help.
Deposits will continue to climb, favourable for funding and a sign of confidence in the bank. Retail call savings are growing strongly, in part due to client growth – which is now over 8,6 million customers. Retail fixed-term savings are growing strongly too with the fixed-term funding mix now 70% as reliance on wholesale declines.
Return on equity of 27% compares with 17% for the big four but I expect it to settle around 25% as product pricing is lowered.
Total loan and advances could soon exceed R50 billion. The average loan size will be approximately R8000.
The Capitec credit card, launched on 18 September 2016 in the Western Cape and nationally on 16 October 2016, is being steadily rolled out. Whilst still less than 5% of loans it has a lot of potential.
I expect provisioning to remain prudent but arrears could increase again to about 6,5% of gross loan book. Provision for doubtful debts as a percentage of gross loans and advances could also rise again, possibly to 13,5% compared with only 10,6% in 2015. Part of the increase in arrears is due to a stricter rescheduling policy.
The net loan impairment expense is likely to be around 12% of average gross loans and advances. This comprises bad debts written off, the movement in the provision for doubtful debts and bad debts recovered. Bad debts increased last year due to a change in rescheduling policies and the worsening market. Stricter credit granting criteria should result in a lower movement in the bad debt provision movement.
Common equity tier one capital remains robust are around 30% whilst if perpetual preference shares and subordinated debt are included there is a total capital adequacy ratio of 33%. Capitec applies Basel 3 regulatory adjustments in full.
The bank continues to expand employment, now over 13 000, with the branch network exceeding 800 branches. Capitec has extended branch opening hours with around 300 open on Sundays and some operating until 10pm. Smaller 100m² branches are being rolled out that have on average six staff compared with a normal branch having thirteen staff.
The big difference between the rating of the big four banks and Capitec is the capacity to maintain earnings growth in the mid to high teens. But, if earnings growth stalls the share price of Capitec would either have to remain unchanged for some time, until the rating normalised to the maturity of the business lifecycle, or the share price would have to fall steeply.
Yes, Capitec is expensive at R866 but assuming the strategy continues to be as effectively executed as it is, with Capitec disrupting the old order, then new money should be rewarded in the future.
Capitec is 30,7% owned by PSG and the investment accounted for 47% of the PSG sum-of-the-parts valuation and 55% of earnings, before funding, as at February 2017. Capitec remains preferred to PSG with a long position recommended relative to PSG.
Also see:
Capitec Overtakes Nedbank's Value After Market-Beating Rally
Trading Buy and Portfolio Buy maintained.
Wishing you profitable investing, until next time.
Mark N Ingham
Read more fundamentals by Mark Ingham:
- Brait
- Sibanye
- Barclays
- Sun International
- Telkom
- Sasol
- Naspers
- Woolworths
- Attaq
- AngloGold Ashanti
- Massmart
- Bidvest
- SARB
- Glencore
- Merafe


