

Mark Ingham's Fundamental analysis
Massmart [JSE:MSM]
"Less mass in the mart"
Share price: R105,94
Net shares in issue: 217,2 million
Market cap: R23,0 billion
Rolling exit PE: 18,3x
Forward PE year one: 17,3x
Forward gross dividend yield: 2,6%
Price to book: 3,8x
Fair value: R100
Target price: R100
Trading Sell and Portfolio Sell maintained
What you need to know
My last detailed note on Massmart was dated 10 May 2017 (see “Costs rise, trading density falls, shareholder return drops”).
This note contextualised the deterioration in fortunes of the business since 2008 and reiterated my continued caution on being exposed to the stock. I’d suggest clicking though to that note if you’d welcome a refresh on that content or if you have not had the opportunity to view it yet. In my summation, I commented that “I’d rather shop at some of their stores than own the stock”.
Massmart has had a substantial decline in profitability in recent years, with margin almost halving, and there is a slim prospect of that changing for the better anytime soon. Expenses growth runs ahead of sales growth. Negative operating leverage, cash flow pressure, rising debt, stiffer competition and falling trading density per square metre add to the unhelpful mix.
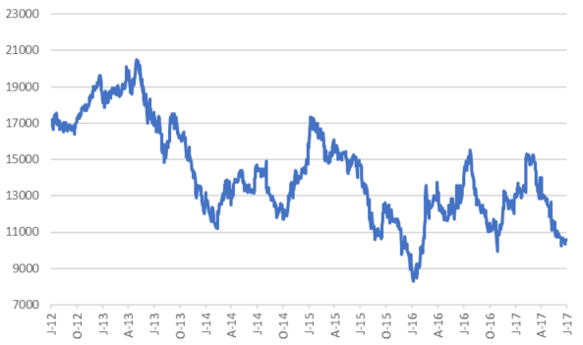
I maintained a Trading Sell and Portfolio Sell with fair value and target price reduced to R100 from R120 previously. The share price at the time was R125,42 whereas the price on 17 July closed at R105,94, having ranged between R102,38 and R106,98.
So, the stock is 15% lower than at the time of my last note, a loss of market cap of R4 billion, and is sharply lower than a few months ago.
However, due to declining earnings a lower share price has not yet translated to a materially cheaper PE ratio. On my projected 2017 EPS of 561 cents, the forward PE ratio is 18,9x, compared to 22,4x on 10 May. You are paying twice what you paid for earnings in 2008 on a PE multiple basis even as return on shareholders’ equity is less than half and dividends less generous. The forward gross dividend yield remains unattractive at 2,6% or 2,1% net of withholding tax. The outlook for earnings over three years is at best flat.
That 10 May note was sent out before the annual general meeting on 25 May. The AGM included a sales update for the first 21 weeks of the 2017 financial year and, as expected, it was a disappointing update.
We now have a sales update for the 26 weeks to 25 June and there is little cheer here either, other than for slightly lower inflation in South Africa. Total sales growth is 0,5% over the prior six months and comparable store sales are down 1,6% with South Africa comparable sales down 0,2%.
Game and DionWired sales fell by 1,4% with comparable sales declining by 3,5%. Inflation was actually negative at -0,3% whereas it was positive at +1,6% at the 21-week mark.
Makro did a bit better, with sales up by 4,0% and up by 1,5% on a comparable basis but with inflation of 3,9% (down from 4,9% at the 21-week mark) there is no real growth.
Builders Warehouse sales were flat and declined by 0,2% on a comparable basis. Inflation also eased slightly to 4,7% from 5,1%.
Finally, cash & carry had a decline in total sales of 1,0% and a 3,3% decline in comparable sales. Inflation eased to 4,0% from 5,5%. This is a largely wholesale business with food a big feature. Suppliers and customers have been alert to prices falling across a number of commodity products, such as maize, and this has resulted in either reduced or delayed purchases and inventory.
On the whole, food sales, unsurprisingly, are proving to be more resilient than general merchandise in the prevailing grim economic and political environment.
Recommendation
At the AGM, the CEO observed that it was “extremely difficult to currently provide any useful short- to medium term economic or performance outlook”. When Massmart releases interim financial results on 24 August it is unlikely that statement will need amending.
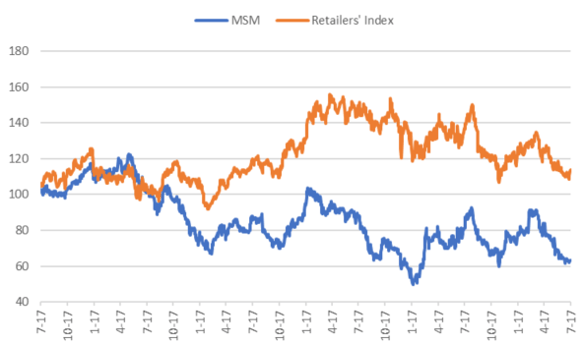
In that context, and considering the deteriorating profitability and other performance metrics, I reiterate that there are better alternatives in the stock market to consider. Even against the Retailers’ Index, which is already soggy, Massmart has underperformed substantially.
Trading Sell and Portfolio Sell maintained with fair value and target price maintained at R100. Post results, I’ll review my earnings estimates and could well review my valuation too. I suspect that after the small dead cat bounce of today we may well see further downside pressure in the stock.
Massmart and Retailers’ Index based to 100 over five years
Massmart share price in ZAR over five years
Wishing you profitable investing, until next time.
Mark N Ingham

Read more fundamentals by Mark Ingham: