
Mark Ingham's Fundamental analysis
BHP Billiton [JSE:BIL]
"Mining Charter Proof"

Share price: AUD24,49 ASX, GBP13,05 LSE, ZAR218,67 JSE
Net shares in issue: 2,11 billion LSE and JSE
Net shares in issue: 3,21 billion ASX
BHP Billiton Limited and BHP Billiton PLC is a dual listed company; PLC has a secondary JSE listing
Market cap: R461,4 billion JSE
Fair value DCF: $21,95, A$29,19 on ASX, £15,56 on LSE (including a 12% discount) and R265 per share on the JSE at an exchange rate of ZAR17,00/£
Trading Buy and Portfolio Buy
What you need to know
My note on AngloGold Ashanti dated 14 July 2017 (see “Tanzanian mining Act yet another headache”) illustrated the risks and uncertainties of mining on the African continent. Here is an example of a stock that offers reasonably good fundamental value but I wrote that “a combination of toxic politics and permanent uncertainty means these factors tend to take precedence over company specific fundamentals”.
Caution is necessary at the best of times when it comes to mining exposure because of the inherent cyclicality of commodities, the unpredictability of demand, volume and prices, the volatility of exchange rates, the complexity and expense of the mining process, and the sensitivity of profits to changes in variables that management have little influence over.
Miners are mainly price takers and can only influence price at the margin through production decisions. China this past decade has become an especially large influence. In steel, China accounts for 43% of global consumption and 50% of production. In almost all commodities, China is the key determinant.
For South African investors seeking alternatives in mining, BHP is a good option to look at. You can be exposed to mining but with less of the geographic and political risk you get in stocks such as AngloGold Ashanti, South32, Sibanye or Amplats. BHP has no mining exposure in South Africa – those assets that are exposed were unbundled in to South32 in May 2015 – so BHP is Mining Charter “proof”.
BHP Billiton is largely exposed to Australia (iron ore, coal, petroleum), United States (petroleum), Chile and Peru (copper), Brazil (iron ore), and Canada (potash).
The failure of the Fundão tailings dam at the Samarco iron ore operation in Minas Gerais, Brazil on 5 November 2015 was an operational problem and is not a political issue. Samarco is jointly owned by Brazilian based miner Vale S.A. and BHP. The failure is subject to negotiation and settlement with future financial impacts on the parties treated as an exceptional item.
BHP released its production report for the year ended 30 June 2017 on 19 July. Overall, it was a positive year for the mining giant with further gains signalled for F2018, with the exception of petroleum.
Production of iron-ore, petroleum, and coking and energy coal was broadly in line with guidance whilst copper was below guidance because of a labour strike at Escondida in the March quarter. Copper production guidance for F2018 is for an increase of 25% to 35% because of production normalising at Escondida (the June quarter was 138% ahead of the March quarter).
Iron ore production in F2018 is anticipated to be 3% to 5% ahead, coking or metallurgical coal 10% to 15% ahead, thermal or energy coal broadly flat, and petroleum down by 9% to 13% overall with the largest decline in onshore US. BHP is ramping up development in onshore US, with capex of $1,2 billion planned in F2018 on five additional rigs.
My forecast price deck and production assumptions are below:
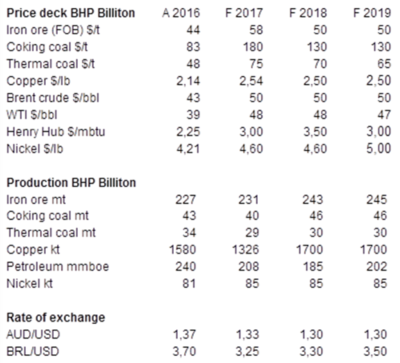
A modestly rising production profile is assumed for iron ore, growing from 231 million tons in F2017 to 245 million tons in F2019. Coking coal is forecast to grow to 46 million tons in F2018 and stay there. Thermal coal is forecast to be flat at 30 million tons. Copper is forecast to normalise at 1 700 kilotons. Nickel is assumed to be flat. Petroleum will decrease in F2018 and then pick up in F2019.
Forecast pricing is also kept conservative with iron ore at $50/ton, Brent crude at $50/bbl, copper at $2,50/pound, and with coal prices easing off slightly.
Petroleum will consume over 50% of group capex going forward (35% on average over the past five years) and thus total group cash flows will be necessary to grow this business. Iron ore share of capex is likely to decline as a share of the total capex to about 20%, in line with copper. Coal capex is likely to be minimal but coal is cash generative.
BHP will record exceptional items of $740 million for H2, of which the strike at Escondida will be $367 million after tax with $373 million stemming from a withholding tax on a Chilean one-off dividend paid. This has no effect on underlying earnings nor on my valuation.
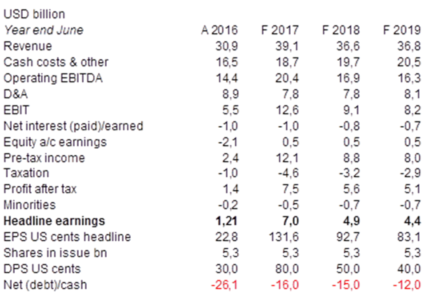
My update earnings estimates indicate a strong result for the year ended June 2017, with EBITDA at $20,4 billion, an increase of 42%. Earnings I forecast to jump sharply to $7,0 billion, which translates to 131,6 US cents per share. However, EBITDA will be below the $30,3 billion in F2014 with earnings also below the $13,3 billion achieved in F2014. Underlying earnings were $15,9 billion or 299 cents per share in F2012.
On my revised estimates, earnings are forecast to fall by 30% in F2018 and by a further 10% in F2019. It is probably safer to work on earnings of $4 billion going forward in a middle-of-the-road scenario on demand and pricing. This is well below the peaks of the commodity boom.
An analyst forecasting earnings and valuing a mining business would typically take a through the cycle view on commodity prices and production.
Spot prices, which tend to be variable, typically affect sentiment in the stock market but are unrealistic to assume as being a fixture for forecasting purposes. This is certainly true of iron ore, which has had a 70% price range this past twelve months. A 1% move in iron ore has a $200 million impact on EBITDA, assuming this applies for a full year, a 1 cent per pound move in copper has a $30 million effect, a $1 move in in the price of a barrel of oil has a $80 million effect, whilst a $1/ton move in the coking coal price has a $40 million impact on EBITDA. In earnings sensitivity, iron ore ranks first, oil second, coal third, and copper fourth.
The balance sheet is sound. I forecast net debt falling from $20 billion at December 2016 to $16 billion as at June 2017. This implies net gearing of 25% on equity of $63 billion. EBITDA interest cover is a chunky 20x, increasing to 21x on F2018 estimates.
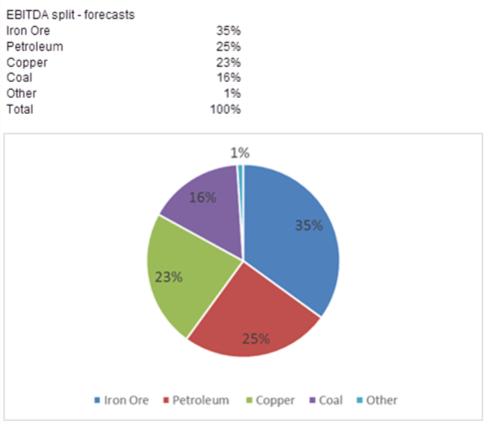
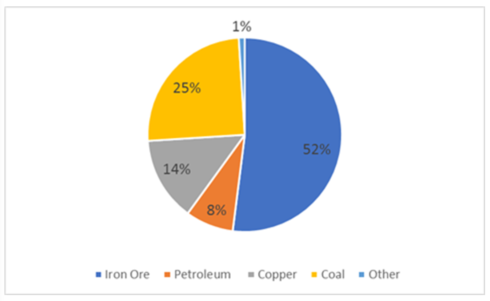
EBITDA over the forecast horizon is split 35% iron ore, 25% petroleum, 23% copper, 16% coal and 1% other.
I have updated my valuation, which realises a higher number than in April, $21,95 per share versus $16,60. This is due to company specific operational factors and a more benign commodity environment.
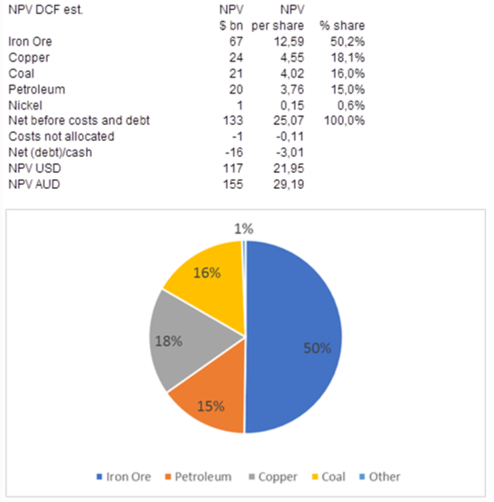
On a DCF, based on my forecast assumptions, iron ore dominates with copper a distant second and then coal and petroleum.
At spot prices, iron ore still dominates and coal comes second with copper third and petroleum fourth.
My most recent note on BHP was issued on 13 April 2017 (see “Elliott Wave”). That note analysed a proposal by Elliott, a hedge fund, for BHP to have a radical corporate restructuring. The note examined the corporate structure of BHP, the valuation dynamics, the technical issue of franking credits in Australia, the impact of buybacks, and the financial feasibility of the Elliott proposal. My conclusion was that “whilst deceptively attractive, the proposal has numerous shortcomings on closer examination and the likelihood of unintended and costly financial consequences”.
To get additional perspective on this topic, I’d suggest clicking though to that note if you’d welcome a refresh or if you have not had the opportunity to view it yet.
BHP is a truly global miner. South Africa these days is a relatively small factor in the share register and of course South Africa does not feature in operations. There are 2,1 billion shares in issue on the LSE and the JSE and 3,2 billion shares in issue on the ASX. Combined, there are 5,3 billion shares in issue and this is the denominator for calculating earnings per share. PLC holds 40% of the aggregate number of issued shares and Ltd holds 60% of the shares. South African shareholders hold 17% of the PLC structure so less than 7% of the combined entity.
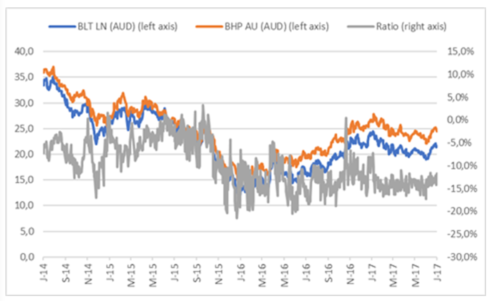
I have updated the share price differentials between PLC and Ltd. The PLC price is converted to Australian dollars at prevailing rates. The “Elliott Wave” note provided an explanation for this.
At the time of writing the discount of PLC to Ltd is 12%, in line with the average for the past two years. Whereas the Australian price is A$24,69 the PLC price of £13,18, at an exchange rate of AUD1,64/GBP, is A$21,64.
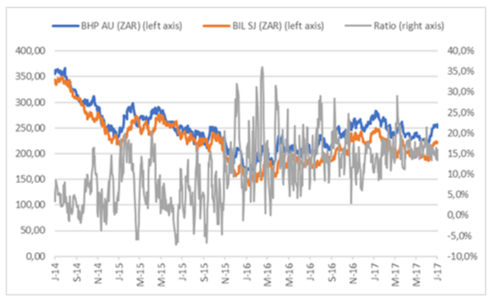
Share prices of BHP Billiton PLC and BHP Billiton Limited in Australian dollar and the ratio between the two
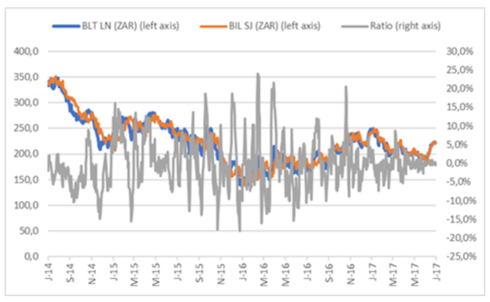
The JSE price mirrors the LSE price rather than the Ltd price on the ASX. There are periodic deviations, such as Nenegate in December 2015, but the ratio tends to move back in line. Over the past two years the difference in the respective share prices in ZAR has been 0,1% - which compares with the 12% deviation between PLC and Ltd. In fact, the share prices of BHP Billiton Ltd on the ASX in ZAR and BHP Billiton PLC on the JSE in ZAR exhibit a near identical pattern to the PLC/Ltd differential.
Share prices of BHP Billiton PLC on the LSE and the JSE in ZAR and the ratio between the two
Share prices of BHP Billiton Ltd on the ASX in ZAR and BHP Billiton PLC on the JSE in ZAR and the ratio between the two
Recommendation
On my conservative scenario DCF, I have iron ore as the largest asset by value on a sum-of-the-parts basis at 50%, followed by copper at 18%, coal at 16%, petroleum at 15%, and nickel and other at 1%.
Enterprise value is $133 billion and equity value $117 billion or $21,95 per share. This equates to an equity value of A$29,19 at an exchange rate of AUD1,33/$. Assuming a 12% LSE and JSE discount the value per share is £15,56 on the LSE and R265 per share on the JSE at an exchange rate of ZAR17,00/£
Based on an enterprise value of $133 billion, the 2017 EV/EBITDA multiple is 6,5x and the forecast 2018 EV/EBITDA multiple 7,9x. Based on the equity value of $21,95, the 2017 PE multiple is 16,7x and the dividend yield 3,6%.
BHP reports annual earnings on 22 August at 08H30 Melbourne, Australia time.
Trading Buy and Portfolio Buy maintained.
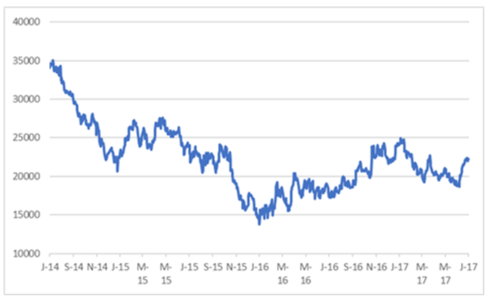
BHP Billiton share price in ZAR cents
Wishing you profitable investing, until next time.
Mark N Ingham

Read more fundamentals by Mark Ingham: