


On the cards tonight is the release of the U.S. Federal Reserve's Federal Open Market Committee (FOMC) January meeting minutes.
- The FOMC meeting minutes will be released later tonight around 21:00 SAST.
As per my U.S Index Technical Trade note from earlier in the week, the markets have been consolidating as was expected and some profit taking might still be on the cards before another move higher.
Economic data that might affect the price action today:
- FOMC Meeting Minutes at 21:00 SAST.
- API Weekly Crude Oil Stock at 23:30 SAST.
Let's have a look at the technical charts for the Wall Street 30:
Wall Street 30
- Our target price of 25592 was reached after a short-term pullback (grey arrows) as per our previous Wall Street Wednesday note. and is consolidating below our then second target price of 25991.
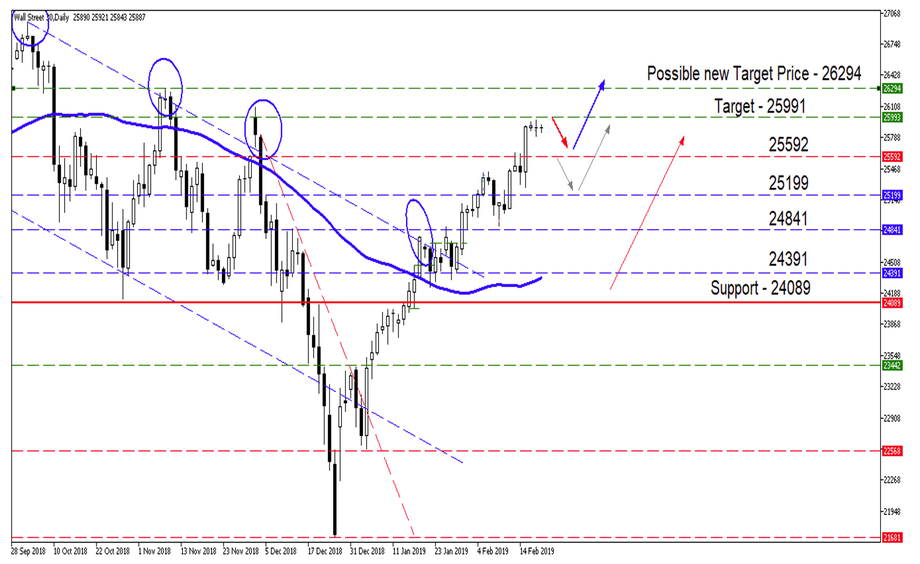
Looking at the Daily Chart of Wall Street 30 below, we can see the price action has had a solid run from breaking out of the descending channel. With the FOMC meeting minutes today and the Trade negotiations in the background we have seen the price starting to consolidate on the lower time frames. For the candle pattern enthusiasts, you can also see a couple of Doji candles forming supporting the indecision.
- Take note: there might still be a pullback on the cards to 25592 if the minutes waver from the dovish stance and the inverted yield curve has also come back into focus.
If all the fundamental factors playout positively then we might see another move higher to November 2018 highs around the 26294-price level.
Source – MetaTrader5

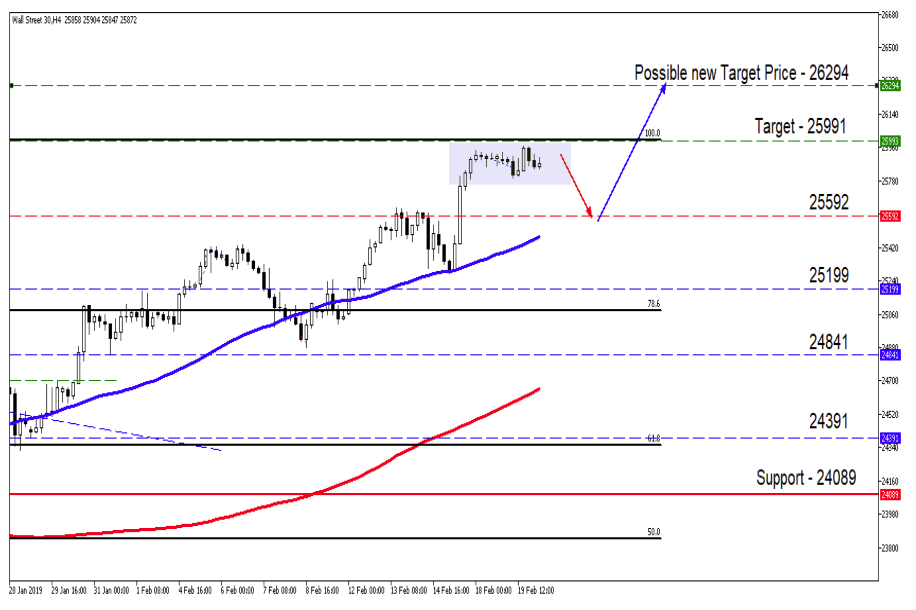
The 4Hour Chart has seen the price action consolidate just below the 25991-price level which happens to be the 100% Fibonacci Retracement level. The price action is waiting on direction from the FOMC meeting minutes later tonight.
- Wall Street is currently trading above the 50 and 200-day Simple Moving Average (SMA) (Blue & Red lines).
Source – MetaTrader5
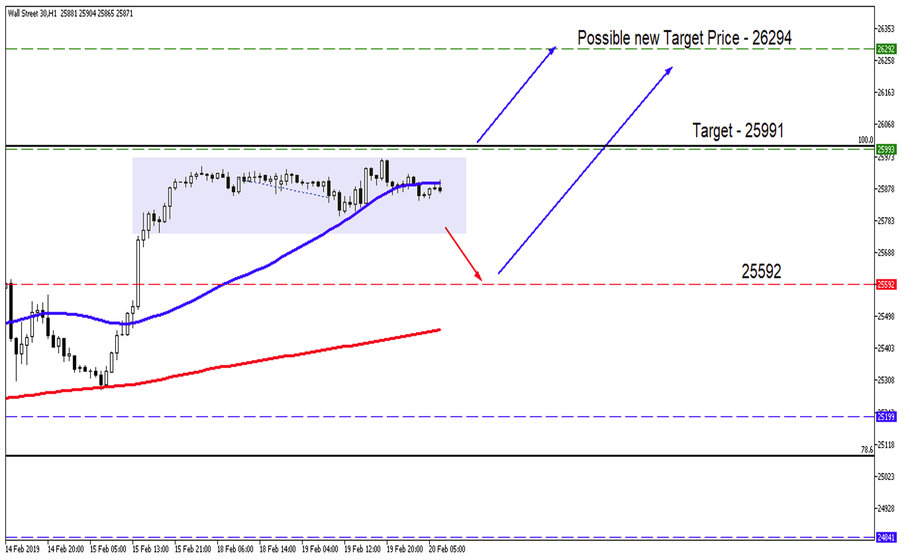
Delving even deeper into the price action when looking at the 1H Chart the consolidation becomes even clearer when looking for an entry point.
- If the FOMC changes their stance on monetary policy, then we might see the price move lower to 25592.
- If the market perceives the minutes to still be in line with the cautious approach in interest rate hikes, then we might expect the price action to breakout of the consolidation and move higher to 26294.
Remember that trading puts your capital at risk. Always trade cautiously and never above your means.
Disclaimer: Any opinions, news, research, analyses, prices, or other information contained within this research is provided as general market commentary, and does not constitute investment advice. GT247.com will not accept liability for any loss or damage, including without limitation to, any loss of profit, which may arise directly or indirectly from use of or reliance on such information. The content contained within is subject to change at any time without notice, and is provided for the sole purpose of assisting traders to make independent investment decisions.
