Looking back at the previous U.S Indices technical note with the surprise Non-Farm Payrolls (NFP) number two of our three index trades have played out nicely.
This week we might see the U.S Markets push even higher as we await the Federal Reserve's Federal Open Market Committee (FOMC) meeting minutes on Wednesday around 21:00 SAST.
Looking at the chart of wall Street 30
We can see that my first target price was reached, looking at Point1 from a better than expected NFP number in the previous note. This week might see some consolidation in the price and some profits being taken off the table until Wednesday.
- If we see the FED meeting minutes still inline with the previous outlook that the FOMC will take a cautious approach in 2019 then we might expect the market to push higher. As seen in Point 1. a higher target price of 26337 might be on the cards. If the outlook from the minutes change then we might expect the price to move lower to 24831 as seen in Point 2.
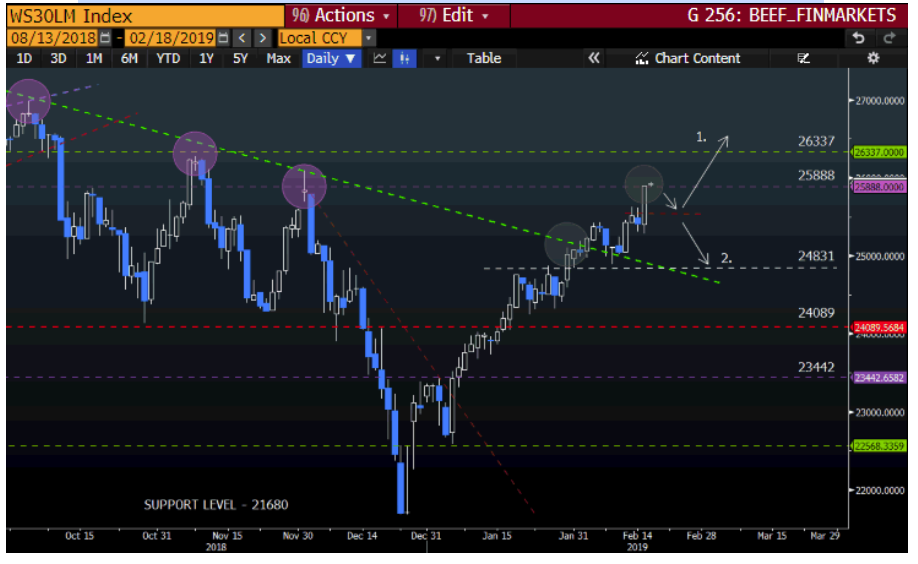
Source – Bloomberg
Looking at the chart of the S&P 500
The FOMC meeting minutes will be a driving factor this week in the S&P 500 index as well and some consolidation at current levels is expected before we see another major move.
We can see the price action reach the 2757 price target from the previous Index note after breaking out of the downward trend. We might expect the price to push higher as seen in Point 1 to 2816 which is a major resistance level. If the fundamental outlook changes from the FED meeting minutes, then we might expect a pullback lower to 2680 as seen in Point2.
- Looking at the technical indicators, the price action is still trading well above the 50-day Simple Moving Average (SMA) (Blue dotted line) which supports the move higher.
- The Relative Strength Index (RSI) is still below the 70 level and still has some way to go before reaching over bought levels.
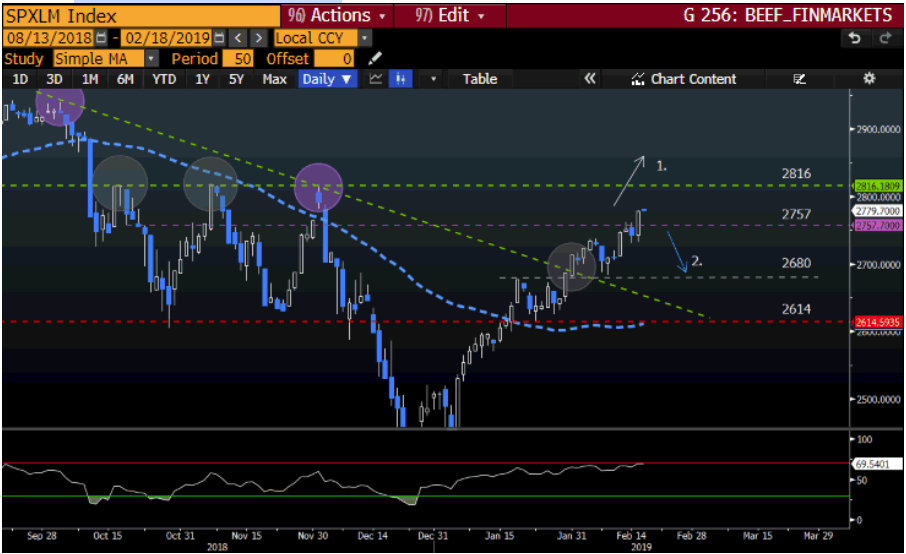
Source – Bloomberg
Looking at the chart of the Nasdaq 100
The Nasdaq 100 has been slow out of the gates and is just short of our target price at 7098. Same as the above indicis, we expect some consolidation to take place before we see another move. Point 1 is still the target price but we might see a push higher to 7200 if the fundamentals of the week playout. If the meeting minutes outlook changes then we might see a leg lower to 6661 as seen in Point 2.
- Looking at the technical indicators we can see the price action still trading well above the 50-day Simple Moving Average (SMA) (blur dotted line).
- The Relative Strength Index (RSI) is at the 65 level and has some way to go to get to overbought levels.
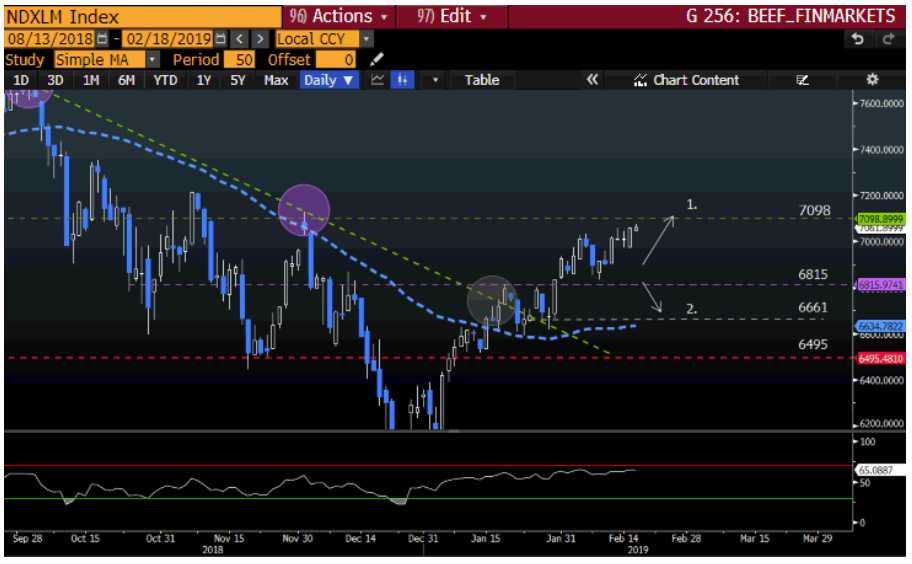
Source – Bloomberg
May your trading day be profitable!