


With a second U.S Government shutdown avoided thanks to an agreement between the Democrats and Republicans on border security, U.S markets rallied on Tuesday.
- The tentative agreement was reached in the attempts to avoid yet another U.S Government Shutdown waiting in the wings. Around $1.5 Billion have been agreed upon for border security which is far less than the $5.6 Billion that President Trump
Renewed optimism around the trade negotiations also added to the momentum in the U.S markets as President Trump stated that he might extend the 1 March deadline to reach a deal with China.
Economic data that might affect the price action today:
- Consumer Price Index (CPI) at 15:30 SAST.
- Crude Oil Inventories at 17:30 SAST.
Let's have a look at the technical charts for the Wall Street 30:
Wall Street 30
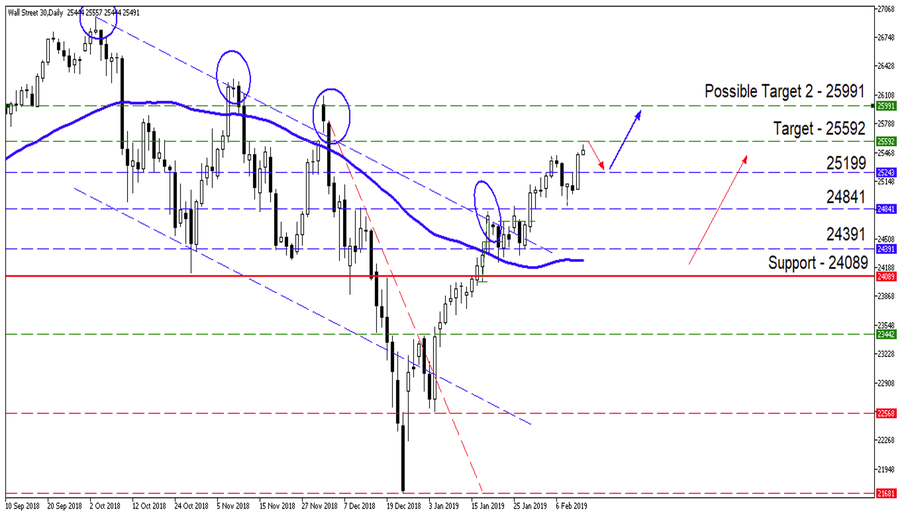
- Looking back at our previous Wall Street Wednesday note, on the Daily chart we can see that the price action pushed higher from the pullback lower. Currently the price action is finding some resistance just before our target price of 25592.
The Daily chart of Wall Street 30 pushed higher from the current dip mainly due to Fundamental factors like the news mentioned. If we see more positive news around the Trade negotiations between the U.S and China, we might just see the price action push even higher.
- Take note: If these fundamental factors play out positively, then we might see the price action reach 25991 as a possible second target price. If no trade deal is reached, then we might see the price action move significantly lower to 24841.
Source – MetaTrader5

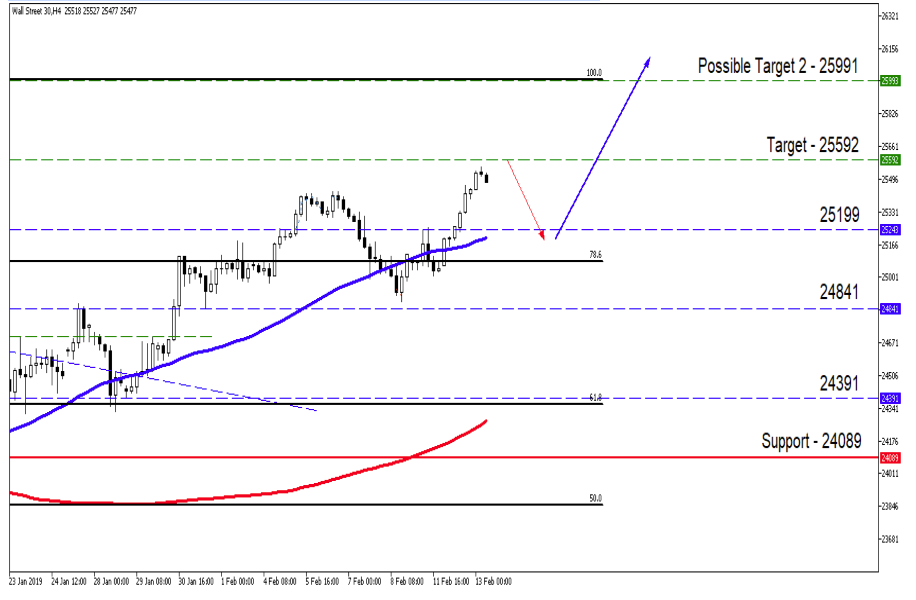
The 4Hour Chart might just see a short-term pullback as traders lock in profits and wait on economic news to push prices even higher. The price action is still trading well above the 50-day Simple Moving Average (SMA) (Blue line) and 200-day Simple Moving Average (SMA) (Red line). We might see the price action move lower to 25199 as a key support level.
Source – MetaTrader5

Remember that trading puts your capital at risk. Always trade cautiously and never above your means.
Disclaimer: Any opinions, news, research, analyses, prices, or other information contained within this research is provided as general market commentary, and does not constitute investment advice. GT247.com will not accept liability for any loss or damage, including without limitation to, any loss of profit, which may arise directly or indirectly from use of or reliance on such information. The content contained within is subject to change at any time without notice, and is provided for the sole purpose of assisting traders to make independent investment decisions.
