


Markets rise on optimism around the global economic recovery which is expected to see more stimulus and easing of lockdown restrictions ahead of the Payrolls report this Friday the 5th of May 2020.
U.S Futures were higher on Wednesday morning with the Nasdaq just 2% below its all-time high despite civil unrest across the United States of America. The U.S Treasury yield curve has also steepened to as high as 1.53% reflecting the stimulus efforts underway.
In this note we take a look at the US economical data and Wall Street 30 technical setups.
U.S Economy
The U.S economy is projected to be in for a rough ride if the Congressional Budget Office (CBO) projections are correct about the lasting effects of the COVID-19 pandemic on the economy. The CBO projects the cost of the pandemic on the U.S economy could be in the trillions over the next decade. In real GDP terms a loss of 3% is projected through 2030 as consumer spending and business investment is expected to be dampened.
U.S Jobless claims
One very important metric to watch this week leading up to the Jobs report on Friday will be the weekly U.S Jobless claims. We have seen historic levels reached in unemployment but have also seen these numbers decline over the past weeks as restrictions are lifted.
Analyst consensus is that this week’s U.S Jobless claims should come in at around 1.8 million which is lower than the previous weeks 2.1 million jobless claims.
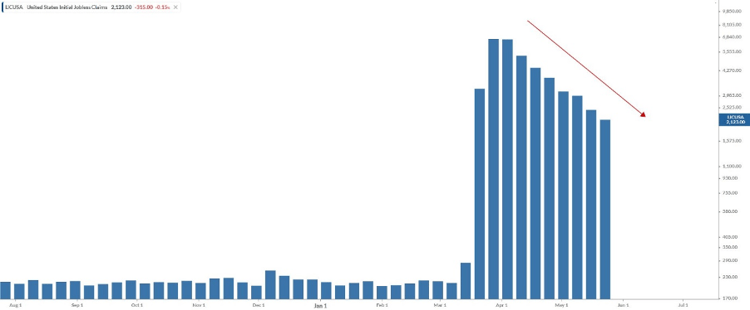
Chart - Weekly U.S jobless claims
US ISM Non-Manufacturing Purchasing Managers Index (PMI)
The Non-Manufacturing PMI number came in a touch better than expected at 45.4 which is higher than the previous reading of 41.8 as lockdown measures are eased across the U.S.
The ISM Non-Manufacturing PMI report is a composite index that reports on business and measures Business Activity, New Orders, Employment and Supplier Deliveries. The index is also used as an indicator to judge how well the economy is performing. A reading above the 50 indicates that the Non-Manufacturing sector is expanding while a reading below 50 indicates a contraction.
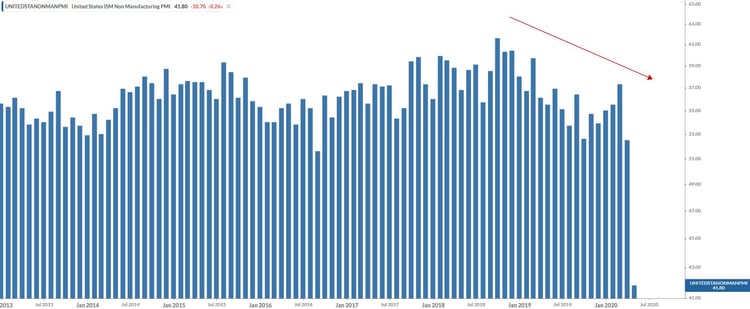
Chart - The ISM Non-Manufacturing PMI
U.S. ADP Non-Farm Employment Change
The ADP Non-farm Employment Change came in much better than expected at -2.76 million for the month of May 2020. It was widely expected to see the U.S. ADP Non-farm Employment Change at a much lower number of -9.5 million.
The U.S. ADP Non-farm Employment Change is an excellent predictor of the Non-Farm Payrolls report as the ADP Non-Farm Employment Change measures the monthly change in non-farm, private employment. The U.S. ADP Non-farm Employment Change is released two days ahead of the NFP jobs number.
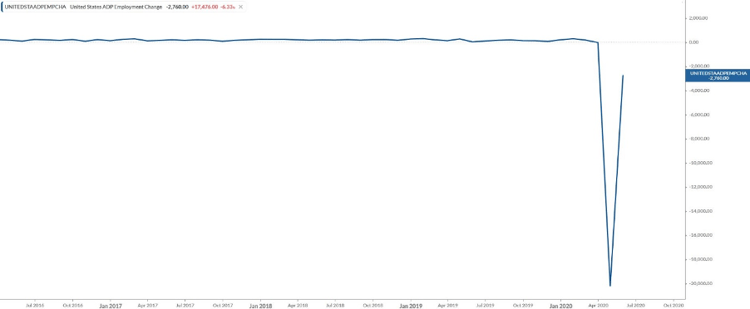
Chart - The U.S. ADP Non-farm Employment Change
Non-Farm Payrolls (NFP) outlook
Jobs number:
The number of new Non-Farm jobs is expected to remain in negative territory, with the data expected to come in at -8 million from the previous month's shocking -20.5 million Non-Farm jobs.
Hourly earnings:
The Average hourly earnings (M/M) number is expected to decrease to 1% from the previous months 4.7% and the Average hourly earnings (Y/Y) is expected to increase to 8.6%
U.S. Unemployment Rate:
The U.S. Unemployment Rate measures the percentage of the total workforce that is unemployed and actively seeking employment during the previous month. The U.S. Unemployment Rate is expected to show a significant increase from the previous reading to 19.7%.
Why is the jobs number important?
The Non-Farm Payrolls report (NFP) is treated as an economic indicator for people employed during the previous month, and the number being released will have a direct impact on the markets. In the United States, consumer spending accounts for most of the economic activity, and the Non-Farm Payrolls report represents 80% of the U.S. workforce. Farmers are excluded from the employment figures due to the seasonality in farm jobs.
Technical Analysis outlook on U.S. Indices for the U.S Non-Farm Payrolls (NFP)
Wall Street 30
The U.S Indices are gaining momentum ahead of the Jobs report which might just deliver a surprise if the ADP number is anything to go by which might see another leg higher.
Our Wall Street 30 Index outlook has reached its target price of 25607 and is pushing higher to a possible new target price of 26721 Index points. If the momentum cannot be sustained or the fundamental outlook does not support the move higher then previous levels of interest might become support levels to look out for.
Technical points to look out for on the Daily Wall Street 30:
- The Wall Street 30 price action has moved higher from our target point and if the rally can be sustained a possible next level of interest might be 26721.
- The 50-day SMA (blue line) is currently pointing higher supporting the higher move now but might act as support if momentum starts to falter.
- The Relative Strength Index (RSI) has stayed above the 50 mark and is approaching the overbought levels at 70.
- The 61.8 Fib level has acted as support to the price action (red circle) with a nice pivot formation supporting the move higher. We might see the golden ratio act as support if the price action momentum starts to falter.
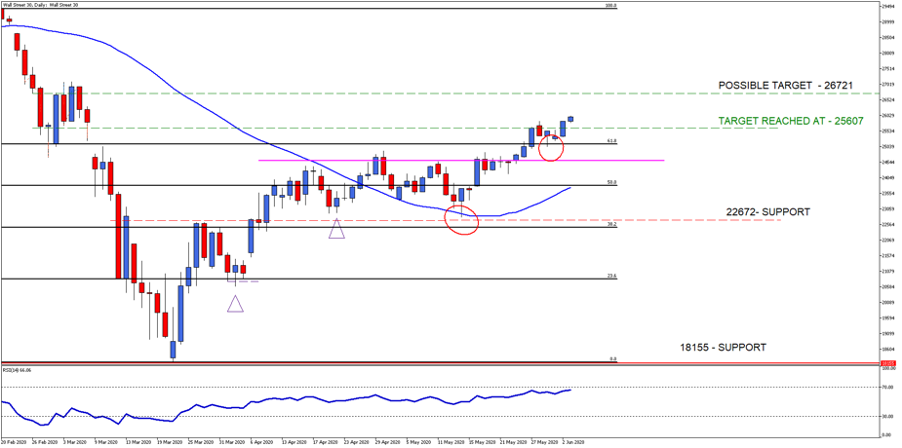
Chart - WallStreet30 Daily
Take note: The outlook and levels might change as this outlook is released during the current days (Wednesday 3rd of June 2020) U.S Market open.
What to trade internationally:
- Major indices to look at will be the S&P 500, Wall Street 30, Nasdaq 100
- Major Forex pairs to look at will be EUR/USD, GBP/USD and USD/JPY
- Commodity to look at will be Gold.
What to trade locally:
- Index to look at will be the ALSI
- Forex pair to look at will be the USD/ZAR
- Rand Hedges (BTI, CFR) and Rand Sensitives (Banks and Insurers)
There are many ways to trade the Non-Farm Payroll (NFP) report, and here are a few strategies traders look at:
- The Early birds: traders who will take an early position before the jobs number is released in anticipation that the directional movement the event will cause will be in their favour.
- The Scalpers: as the data is released, these traders will scalp and try and capitalize on the volatility that is created by the data, positively or negatively.
- The calm and calculated: as the market digest the results of the Non-Farm Payroll (NFP) report and after the volatility swings have occurred, these traders will take a position on the momentum of the market.

When and what time is the US NFP (Non-Farm Payroll) announced in South Africa?
Non-Farm Payrolls are usually reported on the first Friday of the month, whereby the number of additional jobs added from the previous month is released. The US Non-Farm Payroll number will be released locally on Friday the 5th of June 2020 at 14:30 SAST.
Sources – Bloomberg, New York Times, Koyfin, Investing.com, MetaTrader5
Disclaimer:
Any opinions, news, research, reports, analyses, prices, or other information contained within this research is provided by Barry Dumas, Market Analyst at GT247 (Pty) Ltd t/a GT247.com (“GT247.com”) as general market commentary, and does not constitute investment advice for the purposes of the Financial Advisory and Intermediary Services Act, 2002. GT247.com does not warrant the correctness, accuracy, timeliness, reliability or completeness of any information which we receive from third party data providers. You must rely solely upon your own judgment in all aspects of your trading decisions and all trades are made at your own risk. GT247.com and any of its employees will not accept any liability for any direct or indirect loss or damage, including without limitation, any loss of profit, which may arise directly or indirectly from use of or reliance on the market commentary. The content contained within is subject to change at any time without notice. Past performance is not necessarily an indication of future performance. The value of a financial product is not guaranteed. The value of a financial product can go down or up due to various market factors. The graphs are for illustrative purposes only.
