


The U.S is ready to open its economy but at what price? American lives will be pushed to the front lines to stimulate growth despite infection numbers picking up in the U.S. The U.S FED is set to start its bond buying program ahead of this week’s jobless claims and the Payrolls report this coming Friday the 8th of May 2020.
In this note we take a look at the WallStreet30 technical setups.
U.S Economy
The U.S economy’s Gross Domestic Product (GDP) has contracted at an annual rate of 4.8% over Q1 2020 according to the "advance" estimate released by the Bureau of Economic Analysis (BEA). The decline in GDP was contributed to “the response to the spread of COVID-19, as governments issued "stay-at-home" orders in March. This led to rapid changes in demand, as businesses and schools switched to remote work or canceled operations, and consumers canceled, restricted, or redirected their spending.” - BEA
With the coronavirus taking its toll on the U.S economy, the U.S Treasury has announced it would borrow a record $3 Trillion this quarter to try and subsidize economic rescue efforts.
“All the red ink (national debt is near $25T) has some worried about a potential debt crisis and sparked talk about de/inflation, while many see the spending as a temporary lifeline, and see the return to growth despite easy money and massive deficits” - Yoel Minkoff
U.S Jobless claims
U.S Jobless claims have seen Americans filing for unemployment benefits at historic levels with claims reaching 3.839 million for the week ending the 25th of April. The number has seen a decrease from the previous weeks number of 4.442 million.
The concerning factor is that since the start of the COVID-19 crises over 30 million people have been affected and the pandemic is spreading across industries. Analyst consensus is that this weeks U.S Jobless claims should com in at 3 million.
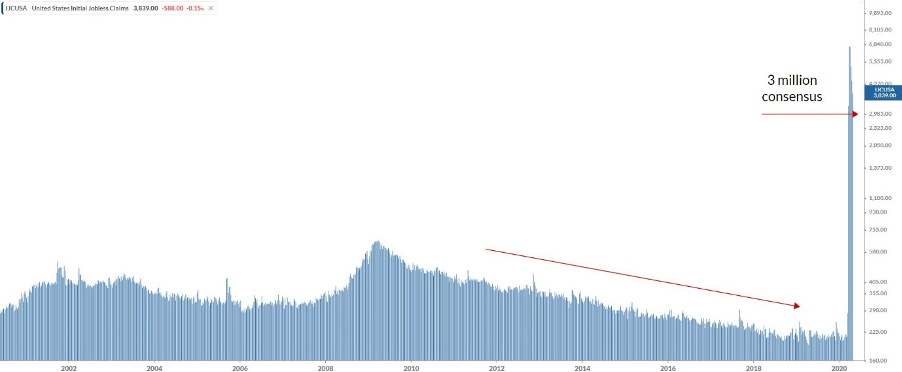
Chart - U.S jobless claims
US ISM Non-Manufacturing Purchasing Managers Index (PMI)
The Non-Manufacturing PMI number is expected to come in higher at 41.8 than the expected at 38.0 but still lower than the previous number of 52.5.
The ISM Non-Manufacturing PMI report is a composite index that reports on business and measures Business Activity, New Orders, Employment and Supplier Deliveries. The index is also used as an indicator to judge how well the economy is performing. A reading above the 50 indicates that the Non-Manufacturing sector is expanding while a reading below 50 indicates a contraction.
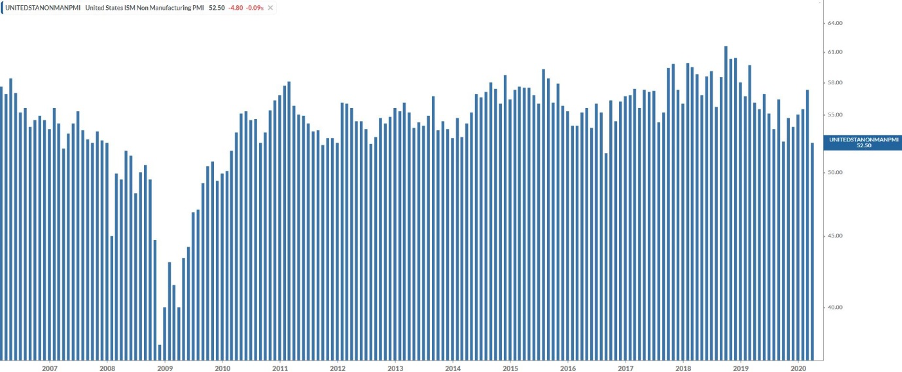
Chart - The ISM Non-Manufacturing PMI
U.S. ADP Non-Farm Employment Change
The ADP Non-Farm Employment Change data is scheduled later today at 14:15 SAST which is expected to remain in negative territory last seen in the Financial Crises.
The ADP Non-farm Employment Change came in much higher than expected at -20,236K for April 2020.
The U.S. ADP Non-farm Employment Change is an excellent predictor of the Non-Farm Payrolls report as the ADP Non-Farm Employment Change measures the monthly change in non-farm, private employment. The U.S. ADP Non-farm Employment Change is released two days ahead of the NFP jobs number.
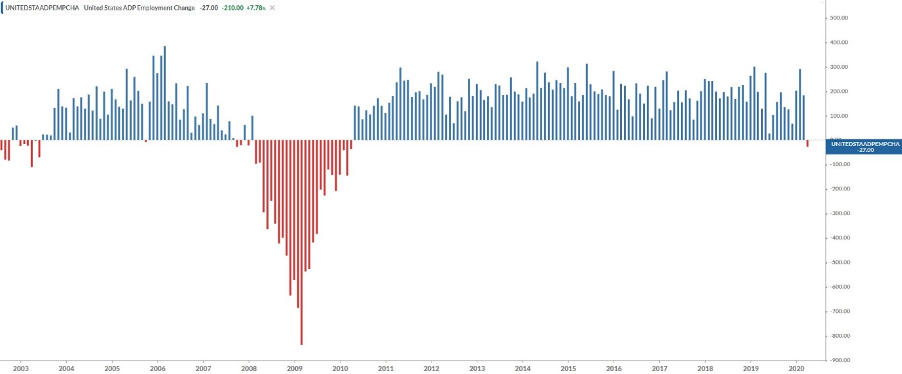
Chart - The U.S. ADP Non-farm Employment Change
Non-Farm Payrolls (NFP) outlook
Jobs number:
The number of new Non-Farm jobs is expected to remain in negative territory, with the data expected to come in at -21,375K from the previous month's shocking -701K Non-Farm jobs.
Hourly earnings:
The Average hourly earnings (M/M) number is expected to decrease to 0.3% from the previous months 0.4% and the Average hourly earnings (Y/Y) is expected to increase to 3.3%
This is a crucial figure to watch, and if this number disappoints, it will signal a weak wage inflation outlook in the U.S.
U.S. Unemployment Rate:
The U.S. Unemployment Rate measures the percentage of the total workforce that is unemployed and actively seeking employment during the previous month. The U.S. Unemployment Rate is expected to show a significant increase from the previous reading to 16%.
Why is the jobs number important?
The Non-Farm Payrolls report (NFP) is treated as an economic indicator for people employed during the previous month, and the number being released will have a direct impact on the markets. In the United States, consumer spending accounts for most of the economic activity, and the Non-Farm Payrolls report represents 80% of the U.S. workforce. Farmers are excluded from the employment figures due to the seasonality in farm jobs.
Technical Analysis outlook on U.S. Indices for the U.S Non-Farm Payrolls (NFP)
Wall Street 30
Volatility has slowed down for the time being but is still present in the U.S Markets as the earnings season progresses. The “dead cat bounce” price pattern did not play out as anticipated but instead the price action started to rally and form higher highs and higher lows. The price action started to form a price pattern which resembled a “cup and handle”.
Technical points to look out for on the Daily Wall Street 30:
- The price action is finding support at the 50-day SMA (blue line) which might support another leg higher.
- Price needs to close above the 24545-resistance level (pink line) to support a move higher to a possible target price of 25607 (Gap close). If this resistance holds then we might expect price to move lower to the 22672-support level.
- The Relative Strength Index (RSI) is moving higher and is above the 50 level which needs to hold to support a move higher.
- The 61.8 Fib level should also be taken note of as the golden ratio is acting as major resistance to the price action.
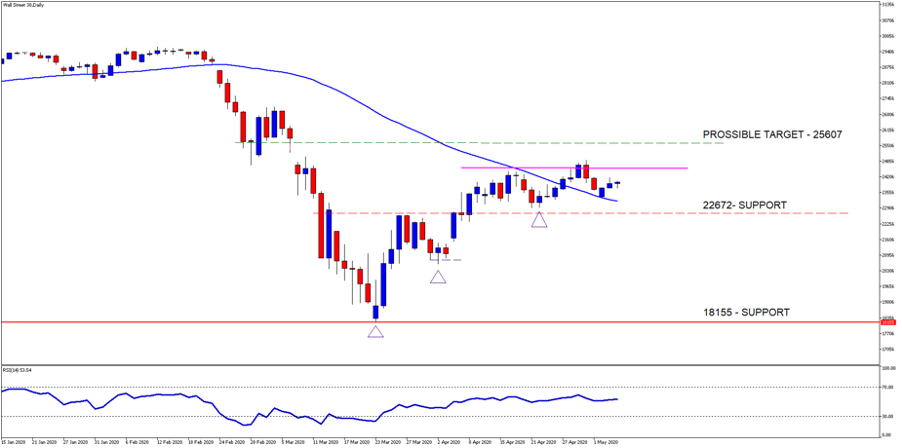
Chart - WallStreet30 Daily
Scaling into a 4H chart of the Wall Street 30 we might see signals earlier and clearer which might provide better entries on this time frame. Here we can see why it is mentioned above to watch the 61.8 Fibonacci level.
Technical points to look out for on the 4H Wall Street 30:
- The price action has been trending higher but needs to close above the 61.8 Fibonacci level to support another move higher. The golden ratio is acting as a major resistance level.
- The 50-day SMA (blue-line) is still trending higher now but will be watched closely in the coming days.
- The Relative Strength Index (RSI) is pushing higher and above the mid-point level.
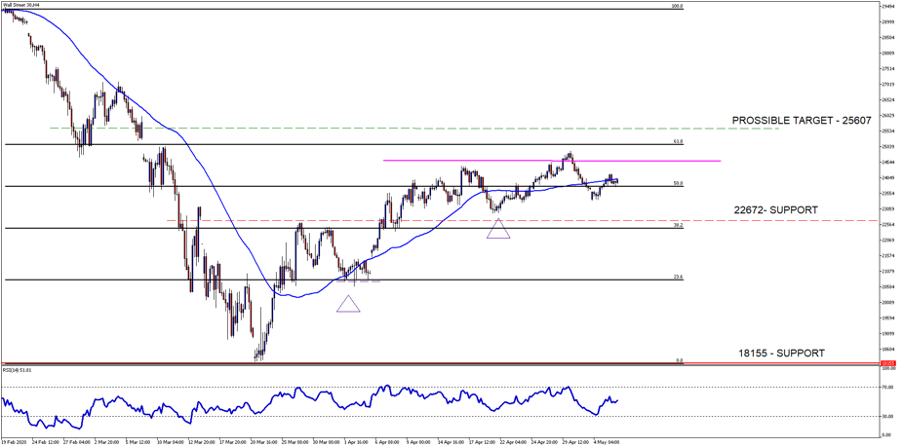
Chart - WallStreet30 4H
Take note: that the outlook and levels might change as this outlook is released before NFP and before the current days (Wednesday 6th of May 2020) U.S Market open.
What to trade internationally:
- Major indices to look at will be the S&P 500, Wall Street 30, Nasdaq 100
- Major Forex pairs to look at will be EUR/USD, GBP/USD and USD/JPY
- Commodity to look at will be Gold.
What to trade locally:
- Index to look at will be the ALSI
- Forex pair to look at will be the USD/ZAR
- Rand Hedges (BTI, CFR) and Rand Sensitives (Banks and Insurers)
There are many ways to trade the Non-Farm Payroll (NFP) report, and here are a few strategies traders look at:
- The Early birds: traders who will take an early position before the jobs number is released in anticipation that the directional movement the event will cause will be in their favour.
- The Scalpers: as the data is released, these traders will scalp and try and capitalize on the volatility that is created by the data, positively or negatively.
- The calm and calculated: as the market digest the results of the Non-Farm Payroll (NFP) report and after the volatility swings have occurred, these traders will take a position on the momentum of the market.

When and what time is the US NFP (Non-Farm Payroll) announced in South Africa?
Non-Farm Payrolls are usually reported on the first Friday of the month, whereby the number of additional jobs added from the previous month is released. The US Non-Farm Payroll number will be released locally on Friday the 8 May 2020 at 14:30 SAST.
Sources – Bloomberg, Koyfin, Investing.com, MetaTrader5
Disclaimer:
Any opinions, news, research, reports, analyses, prices, or other information contained within this research is provided by Barry Dumas, Market Analyst at GT247 (Pty) Ltd t/a GT247.com (“GT247.com”) as general market commentary, and does not constitute investment advice for the purposes of the Financial Advisory and Intermediary Services Act, 2002. GT247.com does not warrant the correctness, accuracy, timeliness, reliability or completeness of any information which we receive from third party data providers. You must rely solely upon your own judgment in all aspects of your trading decisions and all trades are made at your own risk. GT247.com and any of its employees will not accept any liability for any direct or indirect loss or damage, including without limitation, any loss of profit, which may arise directly or indirectly from use of or reliance on the market commentary. The content contained within is subject to change at any time without notice. Past performance is not necessarily an indication of future performance. The value of a financial product is not guaranteed. The value of a financial product can go down or up due to various market factors. The graphs are for illustrative purposes only.
