As traders we have a vast arsenal of technical tools at our disposal and one that I regularly use is Fibonacci Retracement (Fib). Fibonacci was a famous Italian mathematician from the middle ages who is responsible for the Fibonacci sequence numbers.
The Fib numbers are, 0, 1, 1, 2, 3, 5, 8, 13, 21, 34, 55, 89, 144, and continues. The interesting part is when you start adding the first two numbers which then equals the third. Then followed by adding the 2nd and 3rd number which equals the 4th etc.
In Technical Analysis we use Fibonacci Retracement (Fib) in different ways when looking at the price action of an instrument on a chart.
- Support and resistance play an integral part of trading and the Fibonacci levels will guide you to where these levels might be.
- You can use these levels for support, resistance, entry, exit, profit or stop levels as part of your trading plan.

How to get to the prominent Fibonacci Retracement levels:
- 0% is the starting point and 100% will be your end.
- The 23.6% Fib level is derived by calculating any number in the sequence divided by the third preceding number.
- The 38.2% level is calculated by any number in the sequence divided by the second preceding number.
- The 61.8% retracement level which is calculated by dividing one number in the series of Fibonacci sequence numbers by the number that follows it the for example 8/13 = 61.8% (which is the “golden ratio”).
- The midpoint or 50% Fib retracement is not a Fibonacci ratio but a standard retracement level.
In an Uptrend - The levels are plotted when looking at a charts recent swing low and swing high in an uptrend and connecting these reference points. Draw the line from Bottom (swing Low) to Top (swing high) and make sure you draw the line correctly.
When using the lower body of the candle as your starting point, make sure your end is the upper body of the candle. In other words, do not mix the reference points.
- Do not use the candles lower body as the start point (0%) and the candles upper wick at your end (100%) as your levels will be incorrect. Use the candles body for both or the candle wick for both sides.
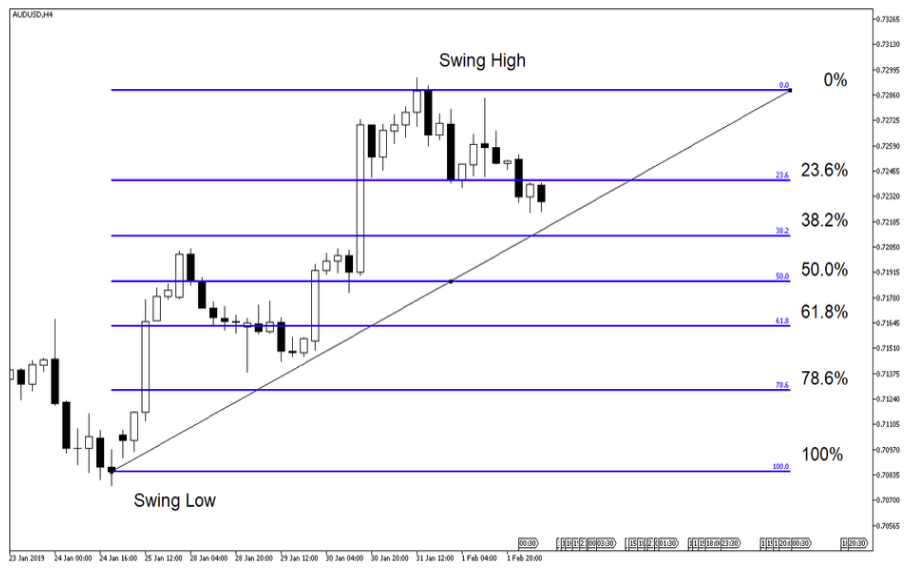
The chart below shows an uptrend and the Fib line drawn from recent swing low to the swing high in the AUDUSD currency pair. We can see that the 23.6% Fibonacci retracement line acted as support a couple of times but did not hold. Price is moving lower to the 38.2% Fibonacci retracement line which might act as support or target line depending on your strategy.
Source – MetaTrader5
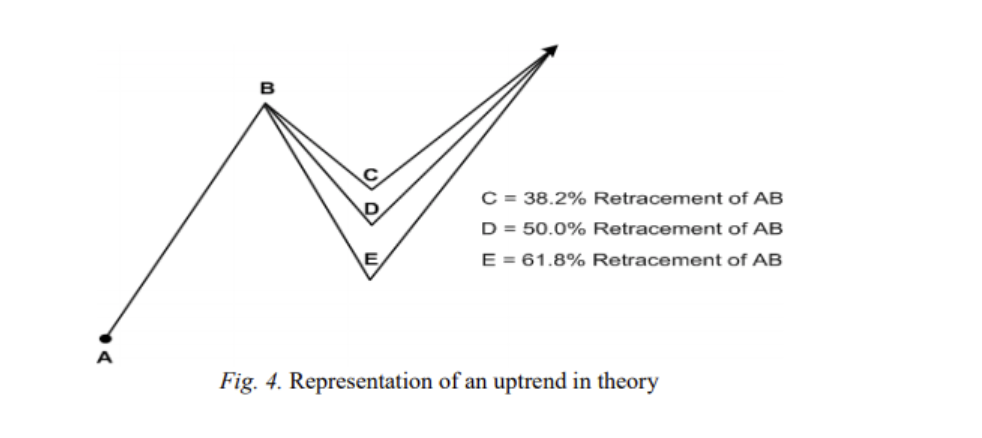
Looking at the chart below we can see possible Fibonacci Retracement levels in an uptrend.
Source – ScientificPapers.org
How did it play out on the AUDUSD, H4?
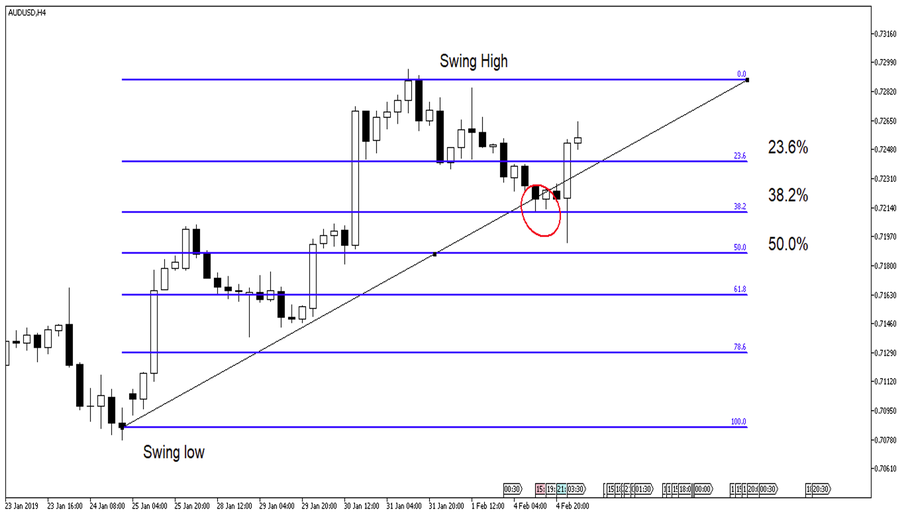
The price action did in fact move to the 38.2% retracement line which could have served as your target point in a short trade from the 23.6% Fibonacci Retracement line. Price action retraced even further but found support at the midpoint line (50% Fib).
Source – MetaTrader5
In a Downtrend – the inverse would apply to the uptrend; the levels are plotted when looking at the Wall Street 30 charts recent swing high and swing low in a downtrend and connecting these points. Draw the line from the high (swing high) to bottom (swing low).
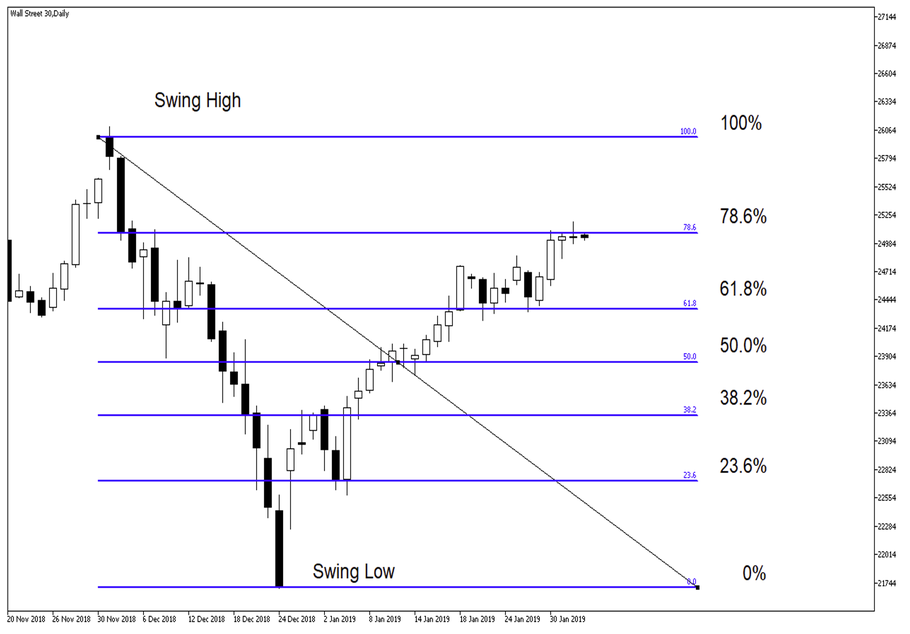
On the Daily chart of Wall Street 30 below we can see that the 78.6% Fib level is currently acting as resistance, so in other words the price has retraced 78.6% from the swing low back to the swing high. This might indicate that the price action might just move higher from this level if it manages to push through. Alternatively, the resistance will hold, and the price action will retreat lower with the 61.8 Fib level as target point.
Source – MetaTrader5
The chart below shows possible Fibonacci Retracement levels in a downtrend.
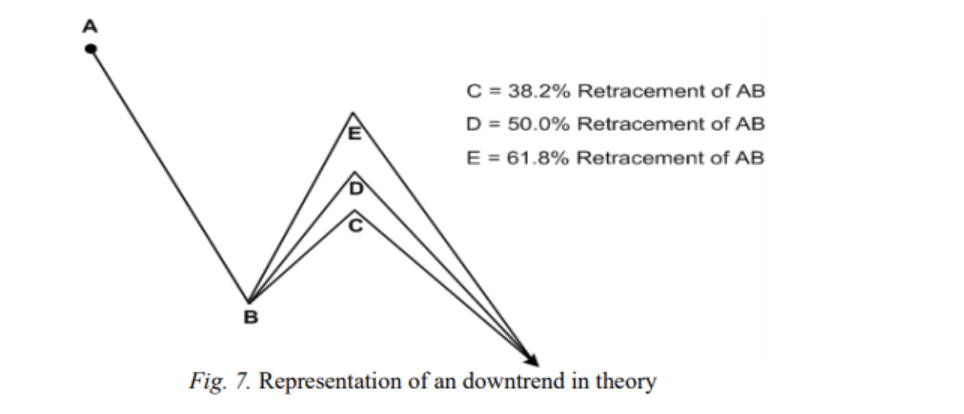
Source – ScientificPapers.org
How did it play out on the Wall Street 30?
The resistance at the 78.6% Fibonacci level did not hold and the price action pushed higher on the Wall Street 30. Looking ahead the 78.6% Fib level will be the new support level to watch moving forward with a target point between current level and the 100% Fib Retracement level.
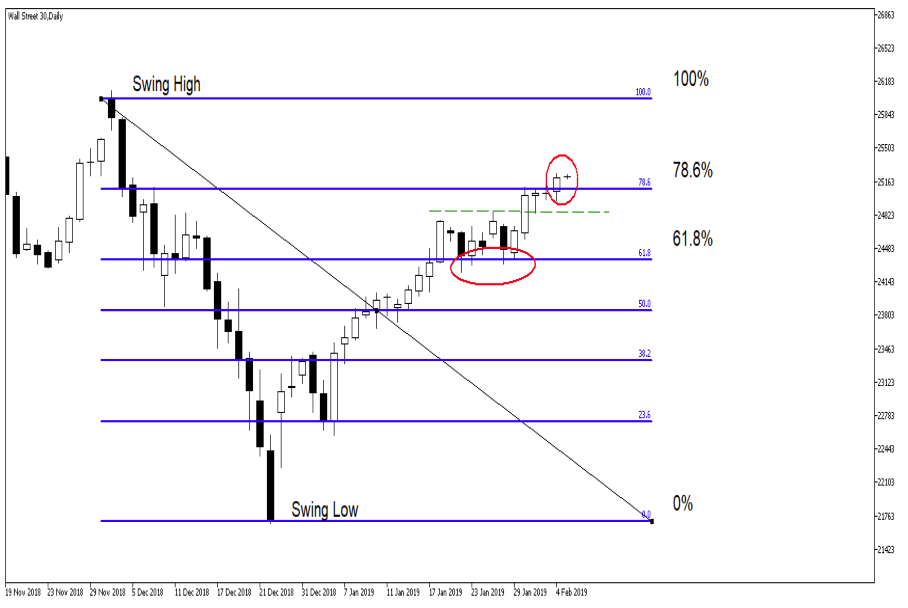
Source – MetaTrader5
Summary:
Thinking of adding Fibonacci Retracement to your trading plan? Or as part of your strategy? Here are a couple things to consider:
- Although Fibonacci give reliable trade setups (levels) in my mind these are only setups with no trigger.
- Look into adding Oscillators to your trading plan/ setup to give you an entry point or trigger as you would want confirmation before getting into the trade. The Moving Average Convergence Divergence (MACD) or Stochastic oscillator might increase your likelihood of a good trade.
- Use longer time frames when applying the Fibonacci Retracement as shorter/ intraday time-frames are less reliable.
Disclaimer:
Any opinions, news, research, reports, analyses, prices, or other information contained within this research is provided by GT247.com at GT247 (Pty) Ltd t/a GT247.com (“GT247.com”) as general market commentary, and does not constitute investment advice for the purposes of the Financial Advisory and Intermediary Services Act, 2002. GT247.com does not warrant the correctness, accuracy, timeliness, reliability or completeness of any information which we receive from third party data providers. You must rely solely upon your own judgment in all aspects of your trading decisions and all trades are made at your own risk. GT247.com and any of its employees will not accept any liability for any direct or indirect loss or damage, including without limitation, any loss of profit, which may arise directly or indirectly from use of or reliance on the market commentary. The content contained within is subject to change at any time without notice.


