


While the U.S mulls over a fourth stimulus package, market participants will turn their focus to this week’s jobless claims and the Payrolls report this coming Friday the 3rd of April 2020.
U.S jobless claims have been a hot topic of late which has seen Americans filing for unemployment at historic levels. Last weeks data showed an increase in jobless claims of 3.28 million, the most in U.S history. This week’s release of jobless claims data, scheduled for Thursday might be even higher according to analysts surveyed as the coronavirus spreads throughout the U.S.
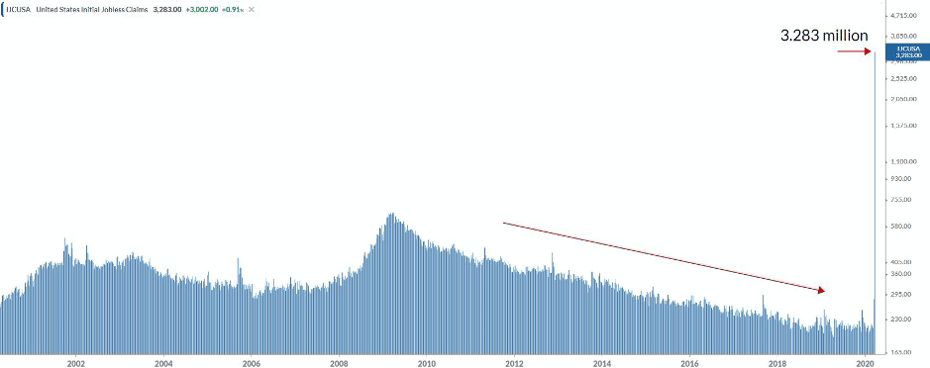
Chart - U.S jobless claims
COVID-19 effects on the U.S Economy
The U.S economy might be at a tipping point, the number of coronavirus (COVID-19) cases has increased significantly putting the U.S above Italy and China. This week’s Non-Farm Payrolls (NFP) release will show a modest picture of job losses in March as the data is before most virus-related shutdowns.
The true picture of job losses might only be seen in weekly initial jobless claims data and the April Non-Farm Payrolls data to be released in May.
Events leading up to the Jobs report on Friday are:
U.S. ADP Non-Farm Employment Change
The ADP Non-Farm Employment Change data is scheduled later today at 14:15 SAST which is expected to move into negative territory last seen in the Financial Crises.
The ADP Non-farm Employment Change expected to come in significantly lower from the previous month at -150K. The U.S. ADP Non-farm Employment Change is an excellent predictor of the Non-Farm Payrolls report as the ADP Non-Farm Employment Change measures the monthly change in non-farm, private employment.
The U.S. ADP Non-farm Employment Change is released two days ahead of the NFP jobs number.
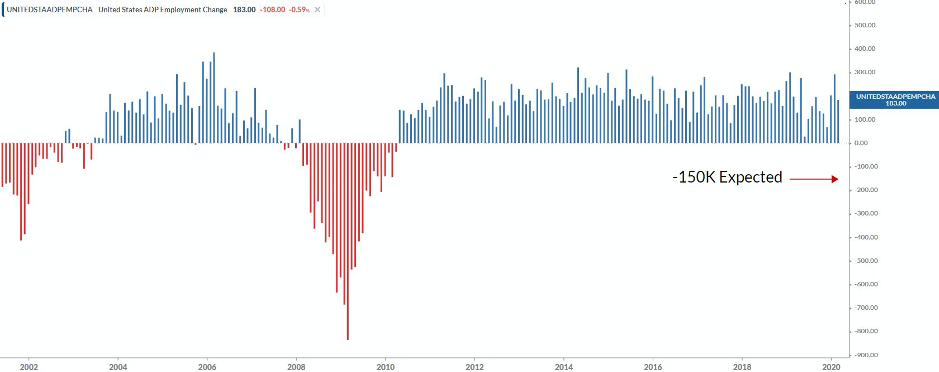
Chart - The U.S. ADP Non-farm Employment Change
US ISM Non-Manufacturing Purchasing Managers Index (PMI)
The Non-Manufacturing PMI number is expected to come in lower than the previous month at 44.0 and will be released on later today the 3rd of April 2020 around 16:00 SAST.
The ISM Non-Manufacturing PMI report is a composite index that reports on business and measures Business Activity, New Orders, Employment and Supplier Deliveries. The index is also used as an indicator to judge how well the economy is performing. A reading above the 50 indicates that the Non-Manufacturing sector is expanding while a reading below 50 indicates a contraction.
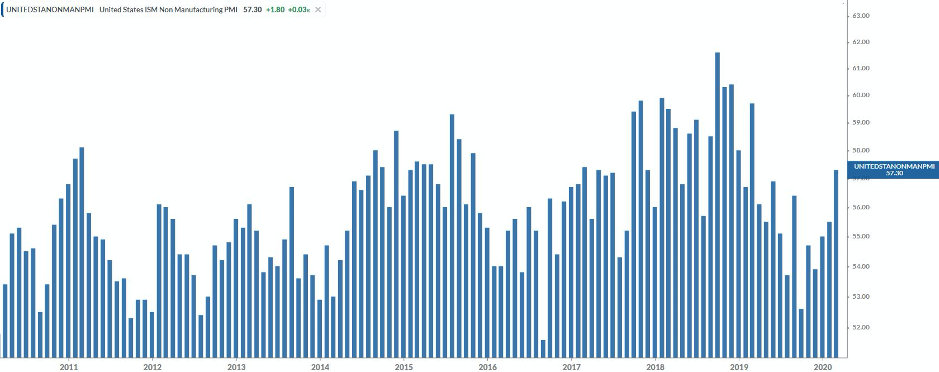
Chart - The ISM Non-Manufacturing PMI
Non-Farm Payrolls (NFP) outlook
Jobs number:
The number of new Non-Farm jobs is expected to move into negative territory, with the data expected to decrease to -124K from the previous month's impressive 273K Non-Farm jobs.
Hourly earnings:
The Average hourly earnings (M/M) number is expected to decrease to 0.2% from the previous month and the Average hourly earnings (Y/Y) is expected to remain unchanged at 3%
This is a crucial figure to watch, and if this number disappoints, it will signal a weak wage inflation outlook in the U.S.
U.S. Unemployment Rate:
The U.S. Unemployment Rate measures the percentage of the total workforce that is unemployed and actively seeking employment during the previous month. The U.S. Unemployment Rate is expected to show an increase from the previous reading to 3.8%.
Why is the jobs number important?
The Non-Farm Payrolls report (NFP) is treated as an economic indicator for people employed during the previous month, and the number being released will have a direct impact on the markets. In the United States, consumer spending accounts for most of the economic activity, and the Non-Farm Payrolls report represents 80% of the U.S. workforce. Farmers are excluded from the employment figures due to the seasonality in farm jobs.
Technical Analysis outlook on U.S. Indices for the U.S Non-Farm Payrolls (NFP)
Wall Street 30
Extreme volatility has become a daily occurrence on the Wall Street 30 index along with the other U.S Indices. The current price action resembles that of a “dead cat bounce” and if it plays out then we might expect to see more downside to come.
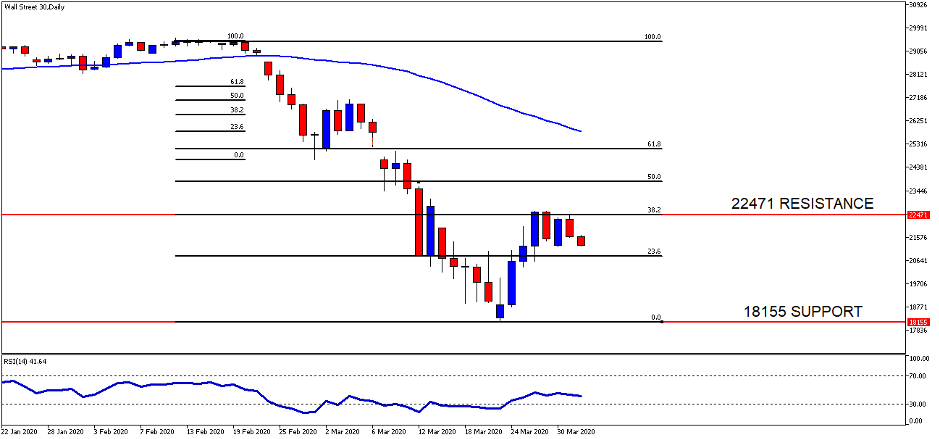
Technical points to look out for on the Daily Wall Street 30:
- The current price action is starting to move lower after the recent rally which is a tell-tale sign of what can be expected in a bear market cycle.
- The market correction is still in process and technically a correction can take anything from 3 weeks to 3 months to play out.
- If price closes below the 23.6 Fib level, then we might expect the price to move lower and target the 18155-resistance level.
Scaling into a 4H chart of the Wall Street 30 we might see signal earlier and clearer which might provide better entries on this time frame. Here we can see why it is mentioned above to watch the 23.6 Fibonacci level.
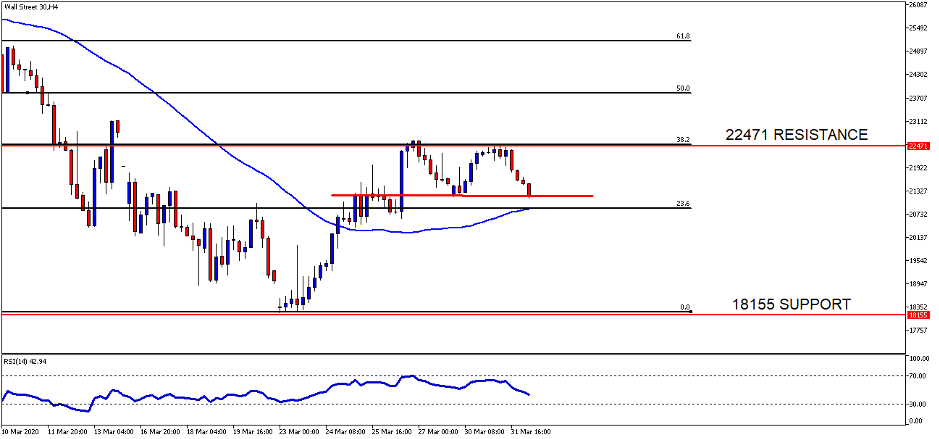
Technical points to look out for on the 4H Wall Street 30:
- The price action has formed a double top which supports another leg lower if we see a close below the 23.6 Fib level.
- The 50-day SMA (blue-line) will meet the price action art the Fib level which might act as support, we need to see a close below this level.
- The Relative Strength Index (RSI) is pushing lower from the overbought level.
Take note: that the outlook and levels might change as this outlook is released before NFP and before the current days (Wednesday 1st of April 2020) U.S Market open.
What to trade internationally:
- Major indices to look at will be the S&P 500, Wall Street 30, Nasdaq 100
- Major Forex pairs to look at will be EUR/USD, GBP/USD and USD/JPY
- Commodity to look at will be Gold.
What to trade locally:
- Index to look at will be the ALSI
- Forex pair to look at will be the USD/ZAR
- Rand Hedges (BTI, CFR) and Rand Sensitives (Banks and Insurers)
How to trade the Non-Farm Payroll (NFP) report: The Strategies
There are many ways to trade the Non-Farm Payroll (NFP) report, and here are a few strategies traders look at:
- The Early birds: traders who will take an early position before the jobs number is released in anticipation that the directional movement the event will cause will be in their favour.
- The Scalpers: as the data is released, these traders will scalp and try and capitalize on the volatility that is created by the data, positively or negatively.
- The calm and calculated: as the market digest the results of the Non-Farm Payroll (NFP) report and after the volatility swings have occurred, these traders will take a position on the momentum of the market.

When and what time is the US NFP (Non-Farm Payroll) announced in South Africa?
Non-Farm Payrolls are usually reported on the first Friday of the month, whereby the number of additional jobs added from the previous month is released. The US Non-Farm Payroll number will be released locally on Friday the 3rd of April 2020 at 14:30 SAST.
Sources – Bloomberg, Koyfin, Investing.com, MetaTrader5
Disclaimer:
Any opinions, news, research, reports, analyses, prices, or other information contained within this research is provided by Barry Dumas, Market Analyst at GT247 (Pty) Ltd t/a GT247.com (“GT247.com”) as general market commentary, and does not constitute investment advice for the purposes of the Financial Advisory and Intermediary Services Act, 2002. GT247.com does not warrant the correctness, accuracy, timeliness, reliability or completeness of any information which we receive from third party data providers. You must rely solely upon your own judgment in all aspects of your trading decisions and all trades are made at your own risk. GT247.com and any of its employees will not accept any liability for any direct or indirect loss or damage, including without limitation, any loss of profit, which may arise directly or indirectly from use of or reliance on the market commentary. The content contained within is subject to change at any time without notice. Past performance is not necessarily an indication of future performance. The value of a financial product is not guaranteed. The value of a financial product can go down or up due to various market factors. The graphs are for illustrative purposes only.
