Opportunities will be in abundance this week as volatility is expected to return to the U.S Markets due to economic and political developments as:
- Trade Negotiations continuing as Trump extends the 1st of March deadline
- The second summit between Donald Trump and Kim Jong Un will take place in Vietnam, 27-28 February 2019.
- OPEC and the Oil price grabs the attention of the U.S President once more.
Revisiting our previous U.S Index Technical Trade Note, the Nasdaq 100 has finally hit it’s target price of 7098. The S&P500 as well as Wall Street 30 are pushing along nicely to their target prices of 2816 and 26337 respectively but a short-term pullback is expected at some point in time.
- The move lower from yesterday can be attributed to the Tweet from President Trump - “Oil prices getting too high. OPEC, please relax and take it easy. World cannot take a price hike - fragile!” – Donald J. Trump
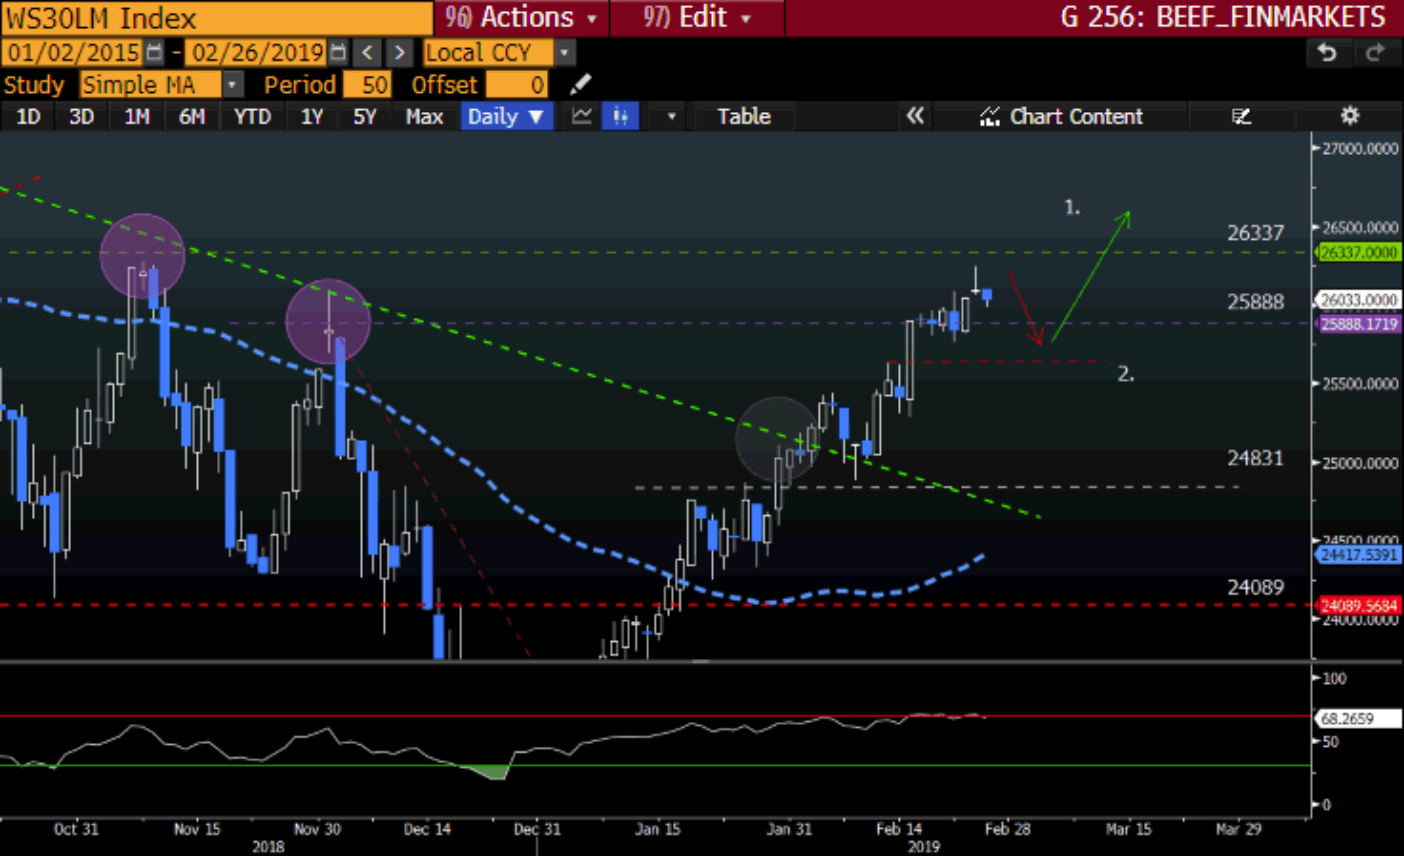
Looking at the chart of wall Street 30
Wall Street 30 has made an about turn just before my 26337-target price and is moving lower as all the major U.S Indices. We might see some support at the 25888 level but might move even lower to Point 2 if we do not receive some positive news from either the Trade Negotiations etc.
- The price action is still above the 50-day Simple Moving Average (SMA) (blue dotted line) and the 200-day Simple Moving Average (SMA).
- Looking at the Relative Strength Index (RSI) it is currently flirting with the 70 level but can move higher into overbought territory.
Source – Bloomberg
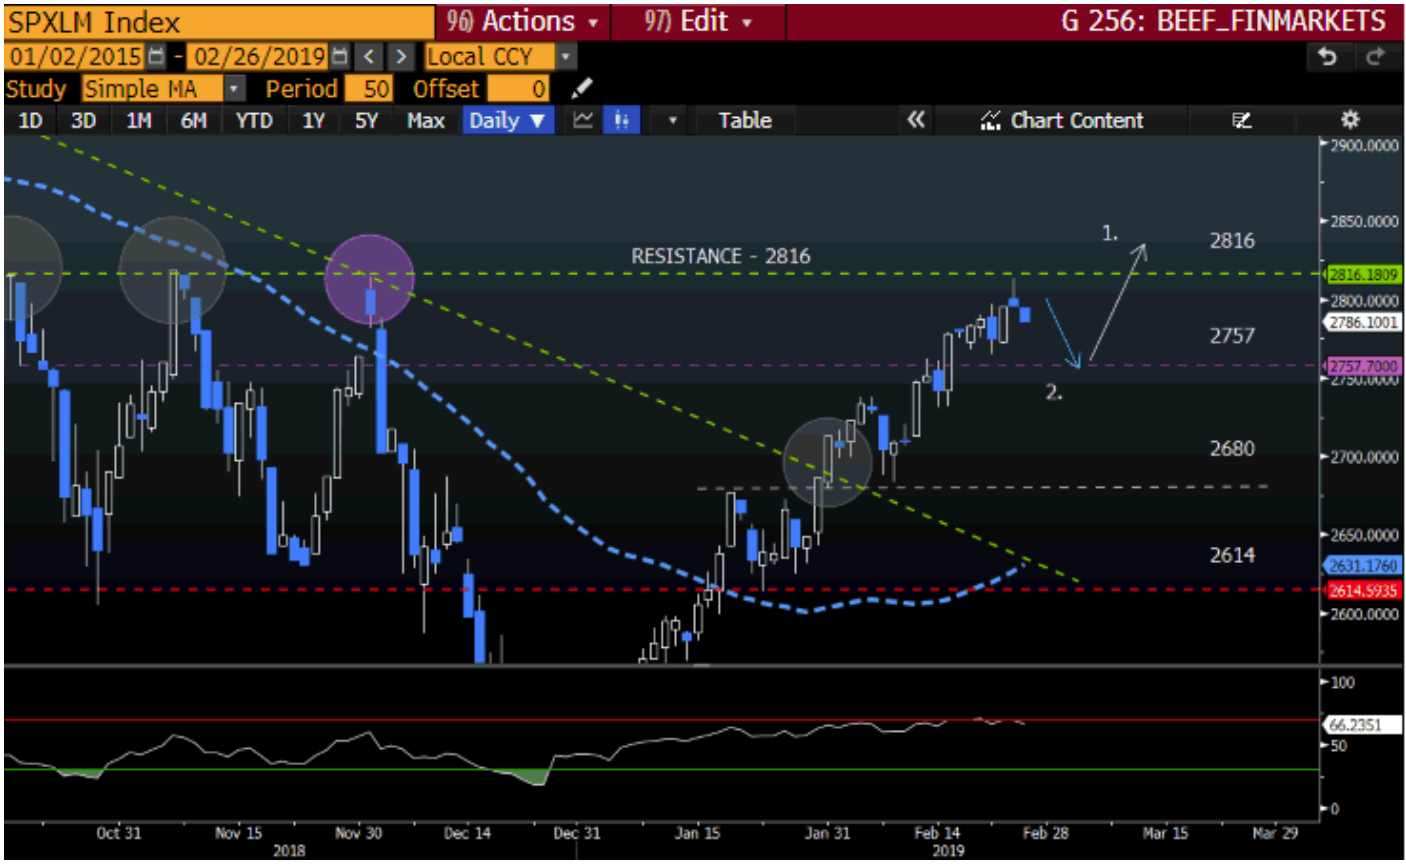
Looking at the chart of the S&P 500
With the Oil market correlating with the S&P 500 over the last couple of weeks it is no surprize that the market moved lower after the Tweet from Trump. The Oil market lost over 3% after the Tweet and the U.S markets started to follow and move lower. We might see more downside to Point 2 at 2757 where the price action might find support before moving higher once more.
- Price action is finding resistance at the 2816 level which coincides with my target price at 2816. The 2816 is a very prominent level to watch in the S&P 500 as the price has been testing that level numerous times over the last couple of months.
- The price action is still above the 50-day Simple Moving Average (SMA) (blue dotted line) and 200-day Simple Moving Average (SMA).
- The Relative Strength Index (RSI) is just below the 70 level and waiting on direction.
Source – Bloomberg
Looking at the chart of the Nasdaq 100
The Nasdaq was slow out of the gates but has finally reached my target price at 7098 as per my previous US Index Technical Trade Note. We might see a short-term pullback lower to the 7002-price level as seen in Point 2.
- The Relative Strength Index (RSI) has not crossed the 70 level as the other two indices which indicates the Nasdaq might have more gas in the tank to push higher.
- The price action is still above the 50-day Simple Moving Average (SMA) (blue dotted line) and the 200-day Simple Moving Average (SMA) is currently acting as support.
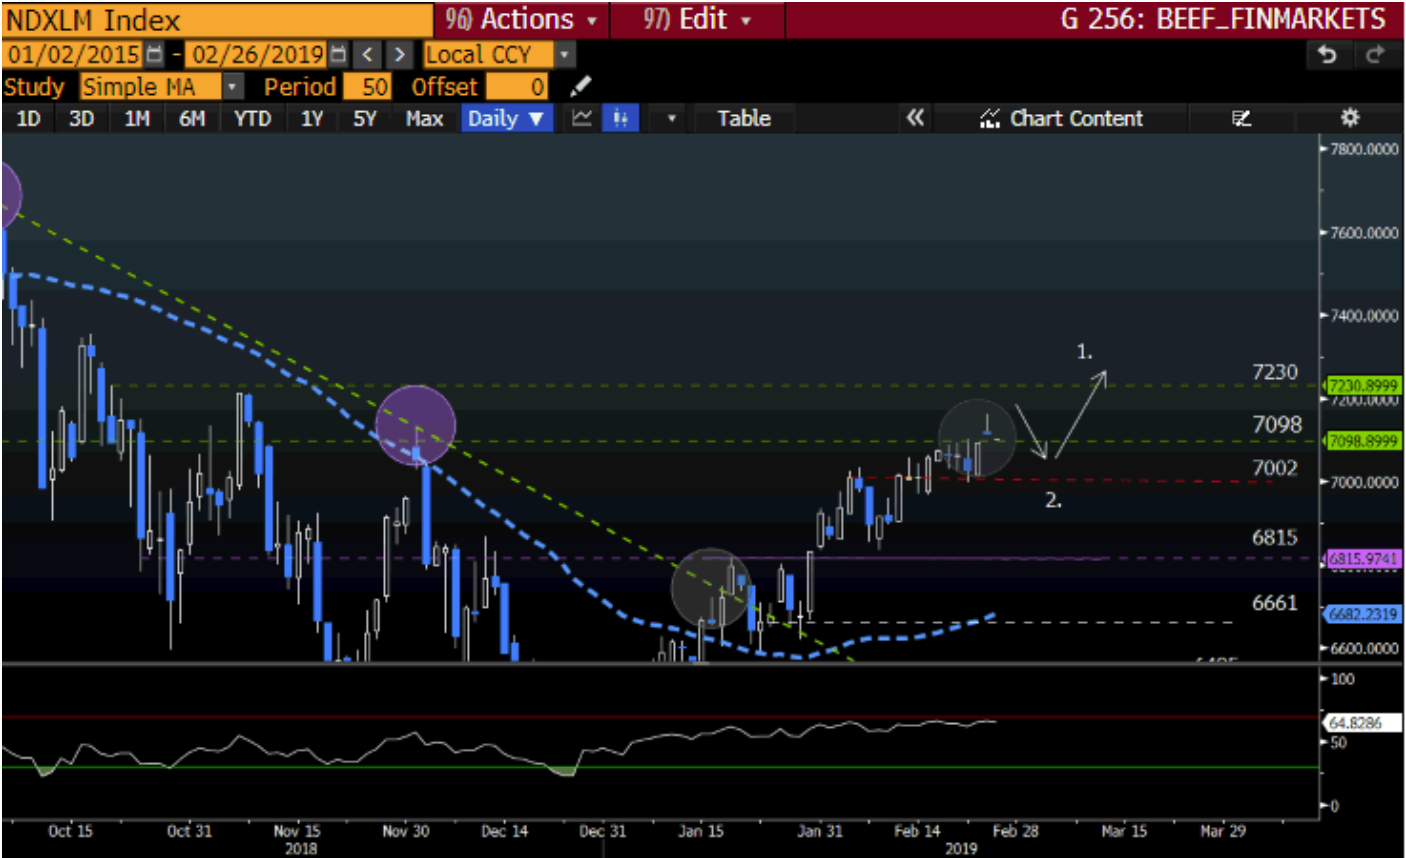
Source – Bloomberg
May your trading day be profitable!
Disclaimer: Any opinions, news, research, analyses, prices, or other information contained within this research is provided as general market commentary, and does not constitute investment advice. GT247.com will not accept liability for any loss or damage, including without limitation to, any loss of profit, which may arise directly or indirectly from use of or reliance on such information. The content contained within is subject to change at any time without notice, and is provided for the sole purpose of assisting traders to make independent investment decisions.