Optimism returned to the Tech Sector as the Nasdaq led rally from yesterday saw the index gain over 2.5% as news surfaced of Nvidia’s merger with Mellanox and Apples product update coming the 25th of March.
Looking at the chart of wall Street 30
A dismal start to the Monday morning trading session which saw the pre-market shares in Boeing fall as much as 17% at one stage as news of the Ethiopian Airlines crash surfaced. Wall Street 30 gains were subdued but managed to pick up much later from the Tech rally.
- The lower target at 25422 was reached as discussed in the previous U.S Index Technical Trade Note from the dismal Jobs report.
- Price action is currently finding support at the 200-day Simple Moving Average (SMA) (white dotted line) which will be watched closely.
- There might be a short-term pullback as seen in Point 2. back to the 25422 level and push higher from there.
- Point 1 will be in play if the bulls take control and drive the price higher back to 26298 which has been the prominent resistance line.
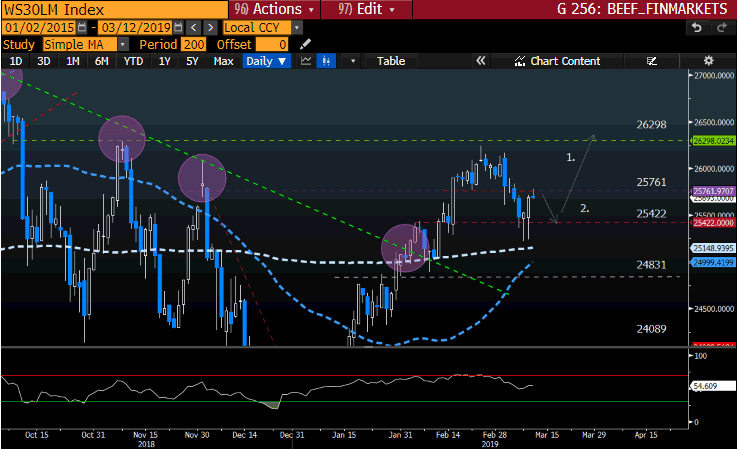
Source – Bloomberg
Looking at the chart of the S&P 500
The S&P500 seems to be heading for the prominent resistance area at 2816 once again and is trading well above its 200-day Simple Moving Average (SMA) (white dotted line).
- If the resistance line holds once more then we might expect a short term move lower as seen in Point 2. If the 2816 line does not hold then we might expect the price action to push higher to 2850 as a first target price higher as seen in Point 1.
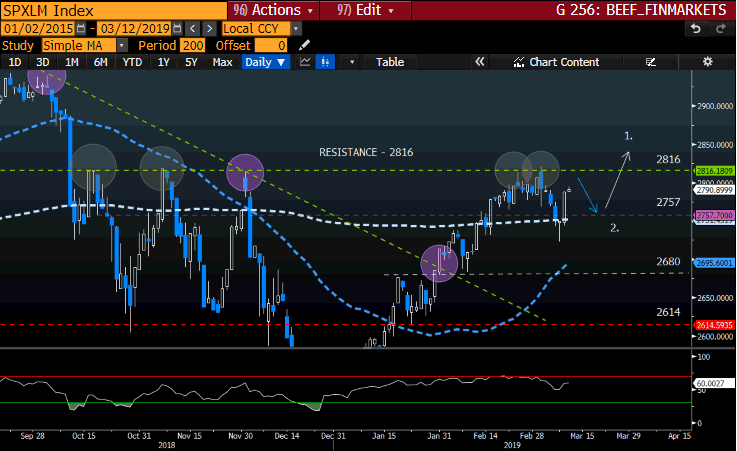
Source – Bloomberg
Looking at the chart of the Nasdaq 100
The Tech Stock rally from yesterday can be seen clearly on the chart below as the price action is headed for resistance at the 7230-price line.
- If the price is rejected at the 7230-resistance area, then we might expect a clear move lower as seen in Point 2. If the price action manages to push higher then a possible target price higher might be 7300 as seen in Point 1.
- Price action is trading well above its 50 day (blue dotted line) and 200 day (white dotted line) Simple Moving Averages.
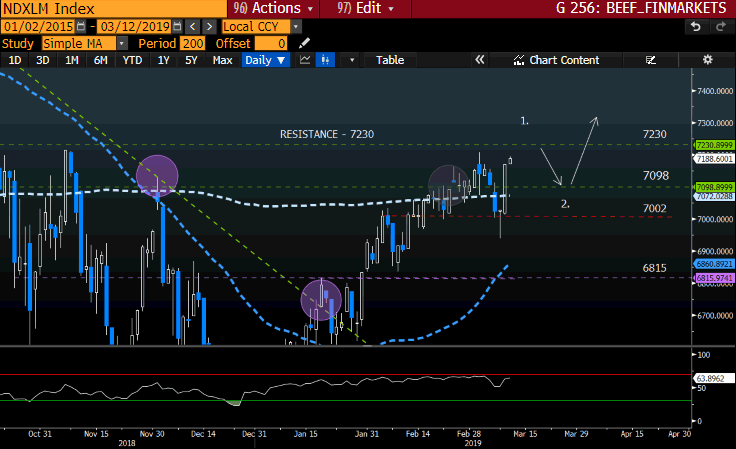
Source – Bloomberg
May your trading day be profitable!
Disclaimer: Any opinions, news, research, analyses, prices, or other information contained within this research is provided as general market commentary, and does not constitute investment advice. GT247.com will not accept liability for any loss or damage, including without limitation to, any loss of profit, which may arise directly or indirectly from use of or reliance on such information. The content contained within is subject to change at any time without notice, and is provided for the sole purpose of assisting traders to make independent investment decisions.