Markets on Monday started on a high as optimism ran wild that a trade deal between the U.S and China would be met as soon as the end of March.
We saw the Dow gain over 120 points in the morning but later gave it all back and more as the index fell over 300 points as market participants came to the realization that a trade deal might not be on the cards at all.
Looking at the chart of wall Street 30
A short-term pullback was expected as highlighted in the previous U.S Index Technical Trade Note and there might be more downside to come if no deal is reached in the trade negotiations as seen in Point 2. It is also a possibility that the price action might start to consolidate between the 25761 and 26298 price levels.
- There might be more downside this week as seen in Point 2. If no deal is agreed upon and if the Jobs number on Friday is a miss. A possible target price lower might be 25422.
- Price is still trading above the 50-day Simple Moving Average (SMA) (blue dotted line) and the 200-day Simple Moving Average (SMA).
- The Relative Strength Index (RSI) is turning lower from the 70 line as the price action is losing strength.
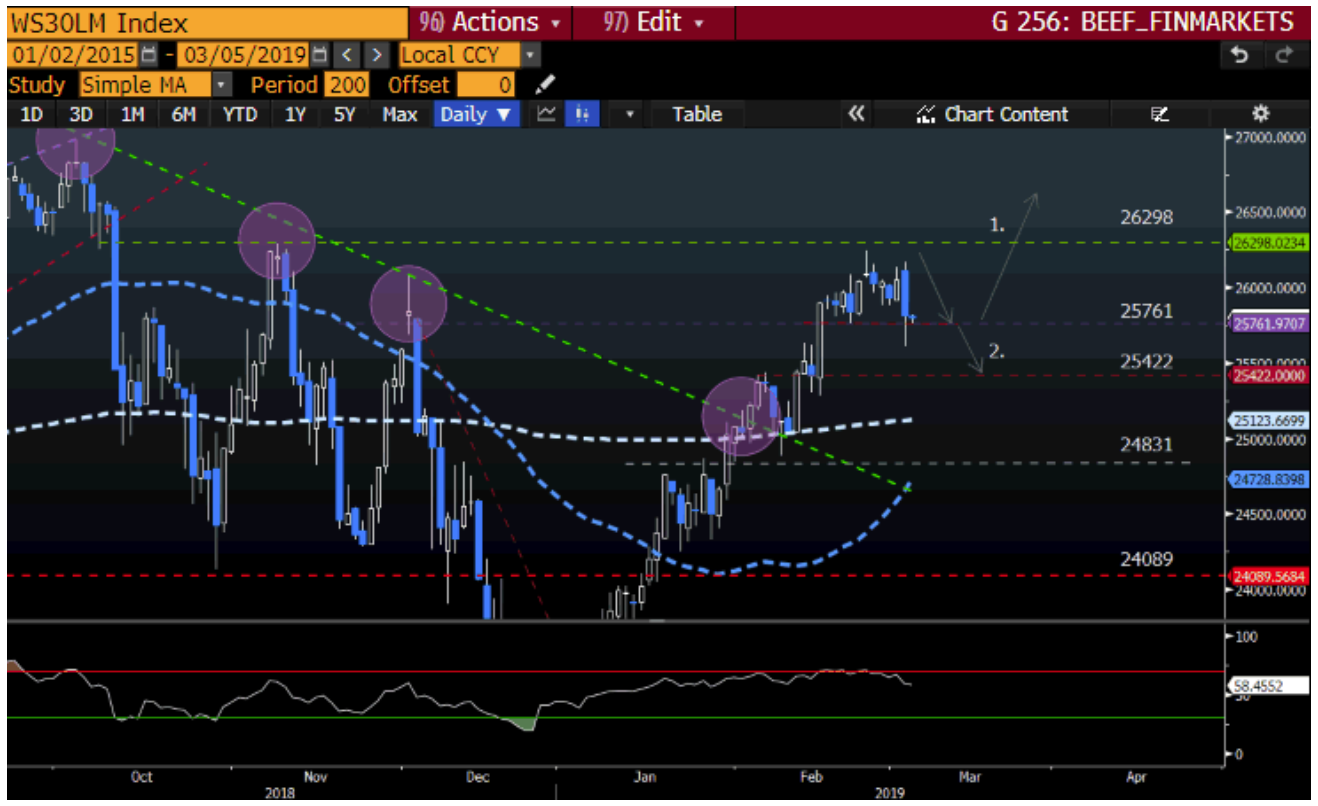
Source – Bloomberg
Looking at the chart of the S&P 500
There is a clear line in the sand on the S&P 500 at 2816 where the price action has been finding resistance since October 2018. The price action did find some support at the 200-day Simple Moving Average (SMA) (white dotted) which coincides with our 2757 support line.
- Price action is still above the 50-day Simple Moving Average (SMA) (blue dotted line) and 200-day Simple Moving Average (SMA).
- If the 2757 support does not hold due to pending fundamental aspects mentioned above, then price might move lower to 2680 over the medium term.
- I will be Keeping a close eye on the 200-day Simple Moving Average (SMA) and the Economic data this week especially the Jobs number on Friday.
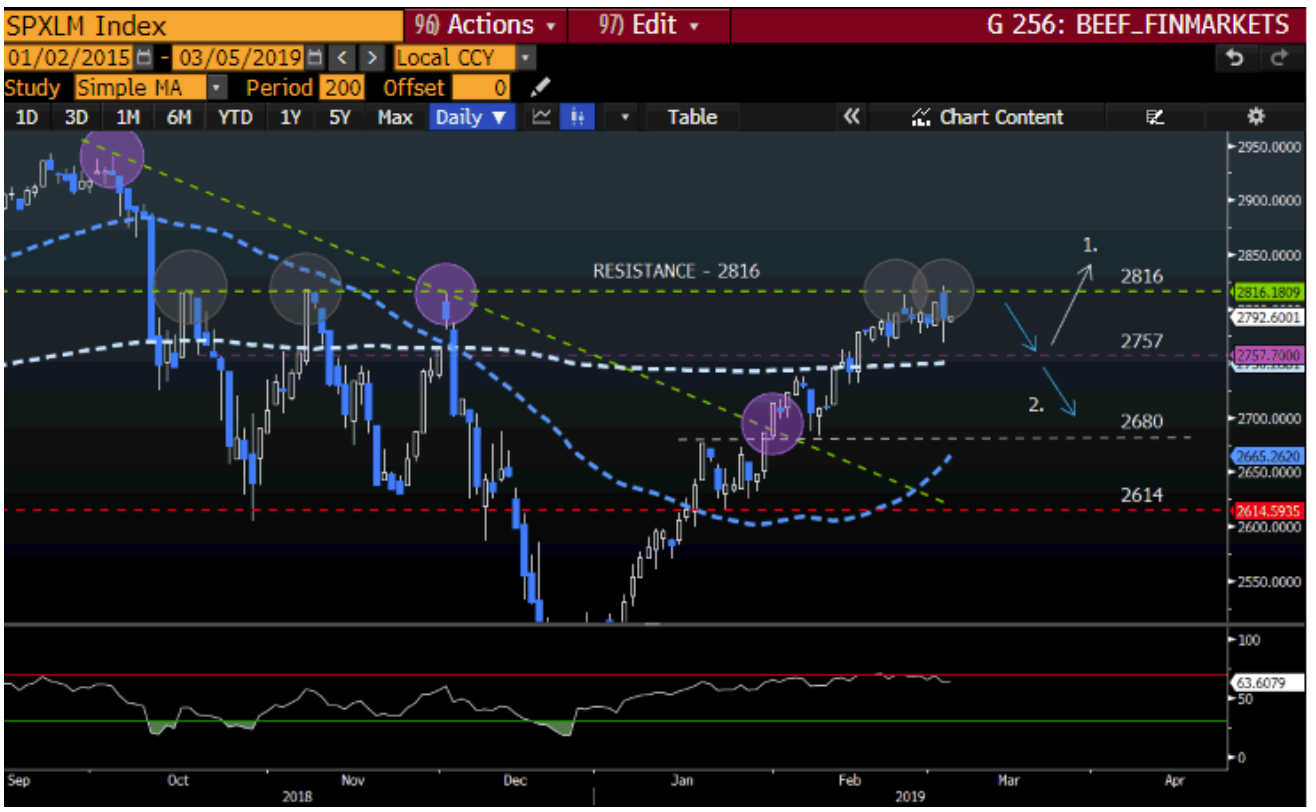
Source – Bloomberg
Looking at the chart of the Nasdaq 100
The Nasdaq 100 is currently trading at its 200-day Simple Moving Average (SMA) (white dotted) which is acting as support. The price action just fell short of the 7230-target price and we might just see the price action move lower still as seen in Point 2.
- A lower target price might be on the cards if the fundamental factors do not play out this week to a lower target price of 7002.
- The price action is still above the 50-day Simple Moving Average (SMA) (blue dotted line) and the 200-day Simple Moving Average (SMA) is currently acting as support.
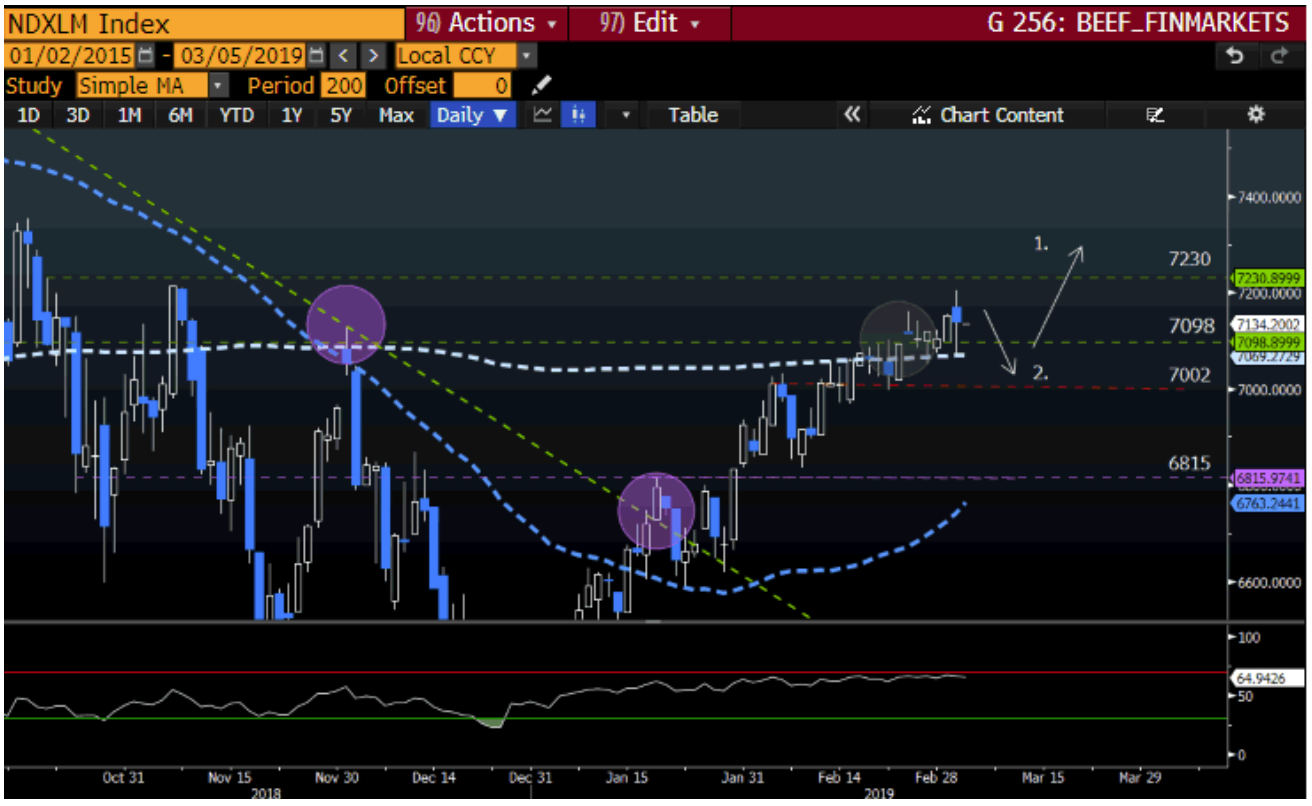
Source – Bloomberg
May your trading day be profitable!
Disclaimer: Any opinions, news, research, analyses, prices, or other information contained within this research is provided as general market commentary, and does not constitute investment advice. GT247.com will not accept liability for any loss or damage, including without limitation to, any loss of profit, which may arise directly or indirectly from use of or reliance on such information. The content contained within is subject to change at any time without notice, and is provided for the sole purpose of assisting traders to make independent investment decisions.