


Commodities have been watched closely by market participants over the last couple of months which saw Oil move from a Bear market at the end of 2018 to a 30% gain in 2019.
A close eye will be on Crude Oil Inventories released tomorrow as well as the U.S. Energy Information Administration (EIA) weekly report to see what the knock-on effects are.
Let’s take a closer look at some of the commodities:
Brent Crude Oil
The Oil market has reached new highs for 2019 mainly due to the Organization of the Petroleum Exporting Countries (OPEC) and partners production cuts. OPEC and its partners are committed to continue and go beyond with production cuts until June when they will meet again.
Technical factors on Brent Crude Oil to look out for are as follow:
- The price action moved higher from the 38.2 Fibonacci support level but still needs to cross the $64.35/ barrel level as described in our previous Commodity Report.
- The price is still trading well above the 50-day Simple Moving Average (SMA) (blue line) which technically supports the move higher.
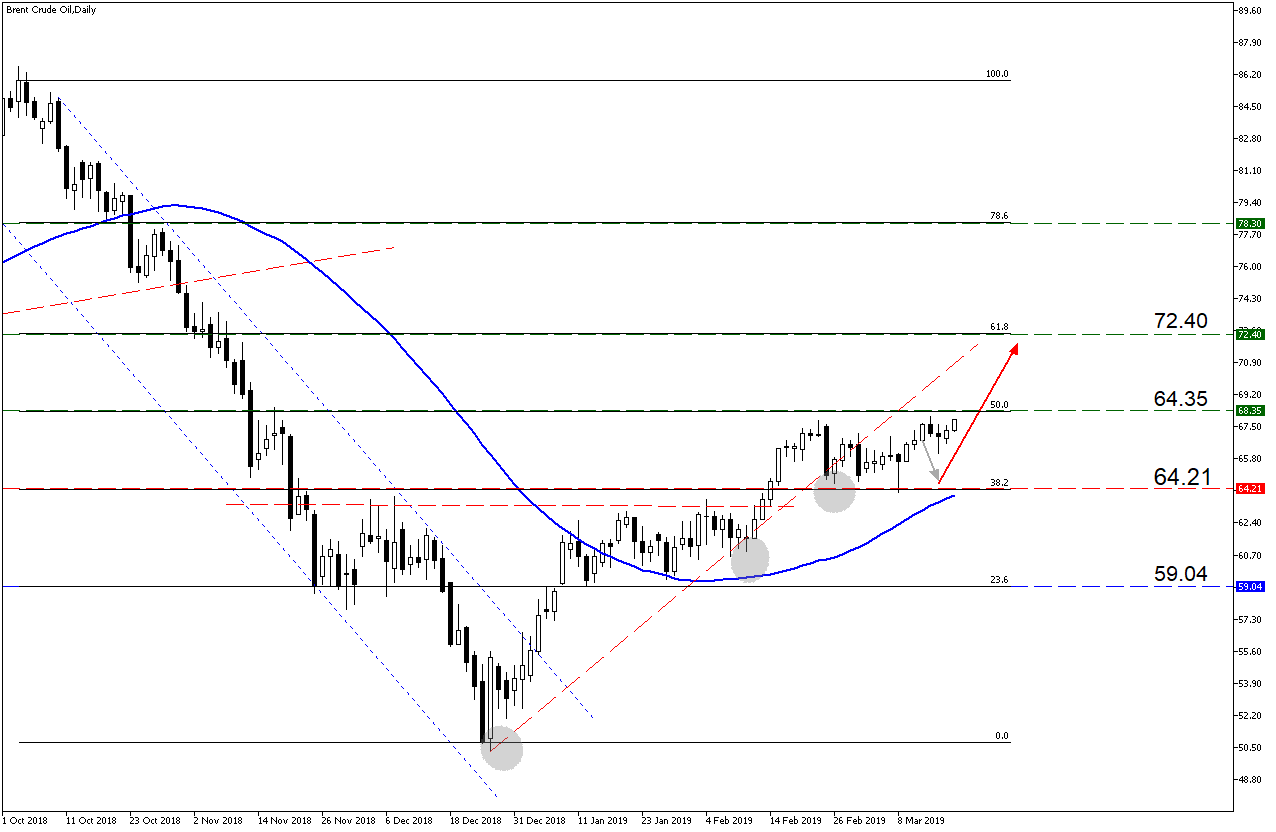
Source – MetaTrader5
Gold
Gold has seen a short term move lower as the U.S Dollar (USD) started to gain momentum but we have seen the precious metal gain some ground over the last week. More volatility is expected the closer we get to the FOMC Interest rate decision on Wednesday 20:00 SAST which might give some direction on Gold.
Looking at some technical factors on the chart:
- The price of Gold is currently trading above the $1302 per pounce level which might act as a technical support level.
- The 50-day Simple Moving Average (SMA) (blueline) has been crossed yet again which might support the move higher but be aware of the FOMC statement.
- If the $1302 per ounce support level does not hold then we might see the price move lower to the $1290 per ounce (blue block).
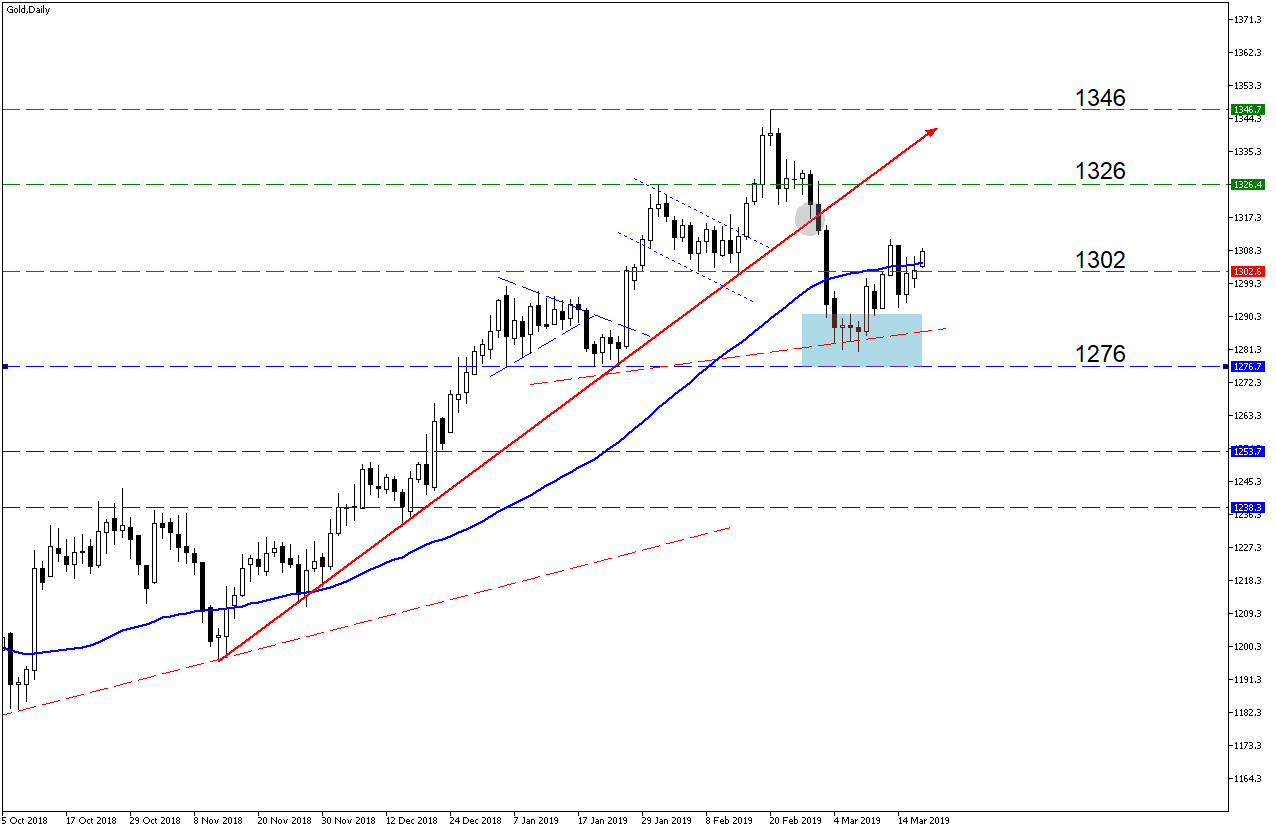
Source – MetaTrader5
Palladium
Palladium has been pushing higher as demand for the precious metal continue to drive the price higher. Supply pressure from Russia continues which saw Palladium back at all time highs and pushing higher.
Looking at some technical factors on the chart:
- Looking back at the previous Commodity Report we can see that the $1505 per ounce support level held and the price action moved higher from there.
- The price action is still trading well above the 50-day Simple Moving Average (SMA) (blue line) which supports the price moving higher coupled with the fundamental factors.
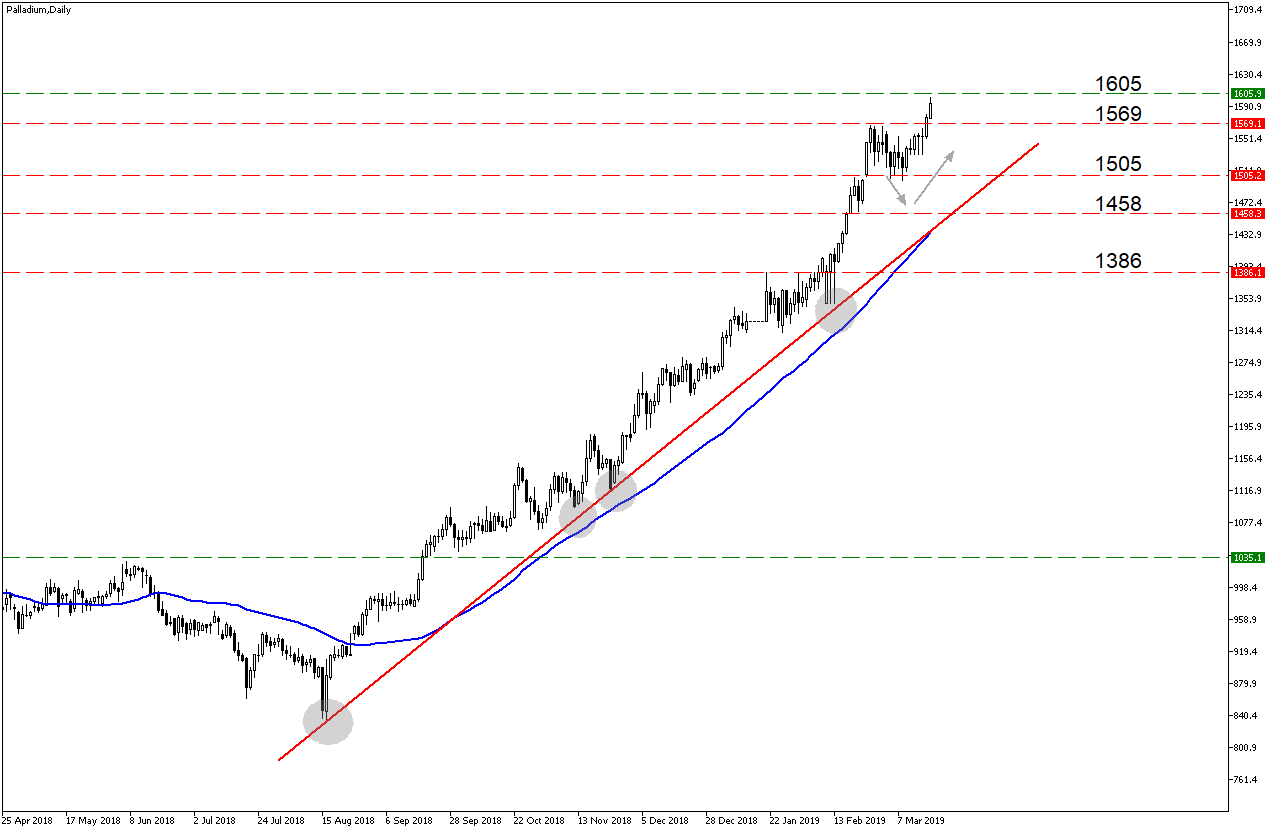
Source – MetaTrader5

Disclaimer: Any opinions, news, research, analyses, prices, or other information contained within this research is provided as general market commentary, and does not constitute investment advice. GT247.com will not accept liability for any loss or damage, including without limitation to, any loss of profit, which may arise directly or indirectly from use of or reliance on such information. The content contained within is subject to change at any time without notice, and is provided for the sole purpose of assisting traders to make independent investment decisions.
