


Asian markets were subdued on Wednesday morning mainly due to growing fears about the U.S economy as to when Congress will commit to the new stimulus package. With consumer confidence at new lows it no wonder the Democrats are pushing for a larger spending commitment.
The U.S. Federal Reserve's Federal Open Market Committee (FOMC) has their work cut out for them as the two-day meeting comes to an end with the interest rate decision later today at 20:00 SAST.
“The Fed is expected to sound reassuringly accommodative at its policy review later in the day and perhaps open the door to a higher tolerance for inflation - something dollar bears think could squash real yields and sink the currency even further” - Reuters
The Wall Street 30 Technical Analysis
The price action on the Wall Street 30 is still flirting with our 26721 (pink line) level of interest which is now acting as resistance. Much uncertainty on the financial markets with consumer confidence and jobs coming into focus ahead of next week’s NFP report.
The weekly jobless claims will be looked at closely which might give us an early warning sign for the NFP number which is already expected to disappoint next week.
Technical points to look out for on the Daily Wall Street 30:
- The short term move lower to the 50-day SMA has arrived and price needs to stay above the SMA to support a move higher.
- The price action might move lower, supported by dismal fundamental outcomes over the week or two which could see price move to the lower level of interest at 24545 (pink line).
- The Relative Strength Index (RSI) must stay above the midpoint (50) to support a move higher. Currently the pullback and move lower is playing out as mentioned last week.
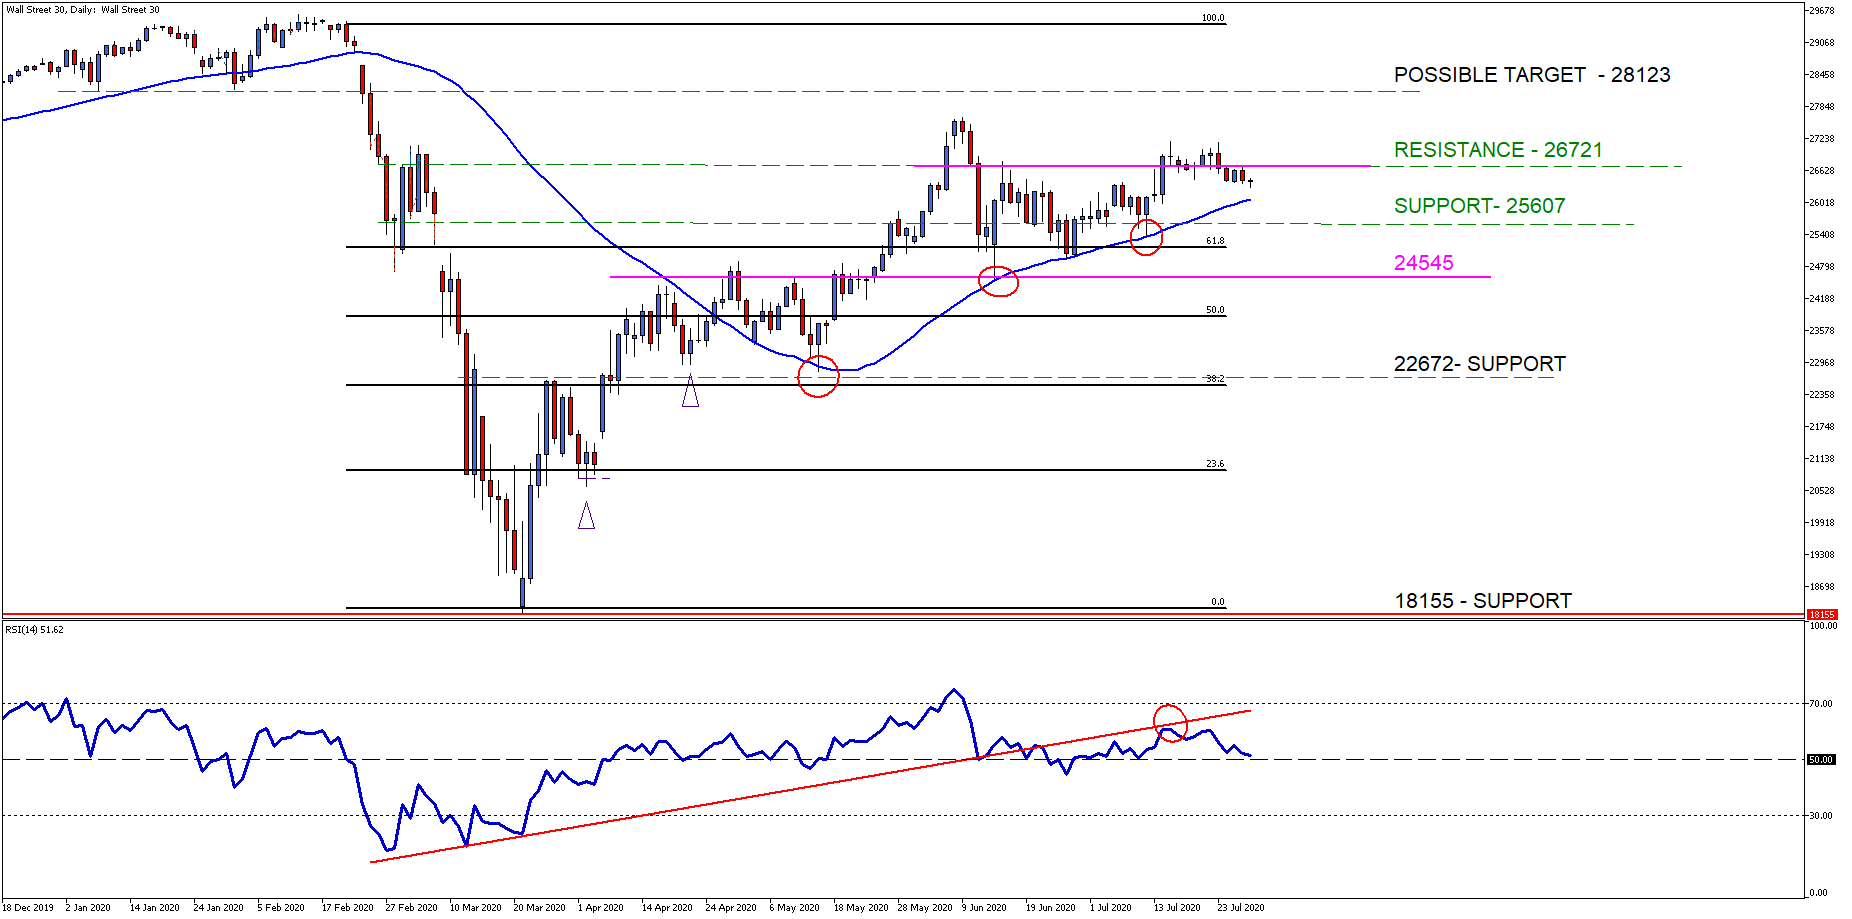
Chart Source: Wall Street 30 Daily Timeframe - GT247 MT5 Trading Platform
Technical insights – what the Beef is looking at now
As mentioned in our previous Wall Street 30 Technical Analysis note a short term move is possible when looking at the price action on the chart below. There has been a rising wedge formation developing which could suggest we might see a move to lower levels.
This outlook should be supported by the Relative Strength Index (RSI) moving below 50 and a break in support of the 50-day SMA (blue line) with a daily close.
If the support levels manage to hold and the price action breakout above the wedge, then we have a good chance of possibly reclaiming all-time highs.
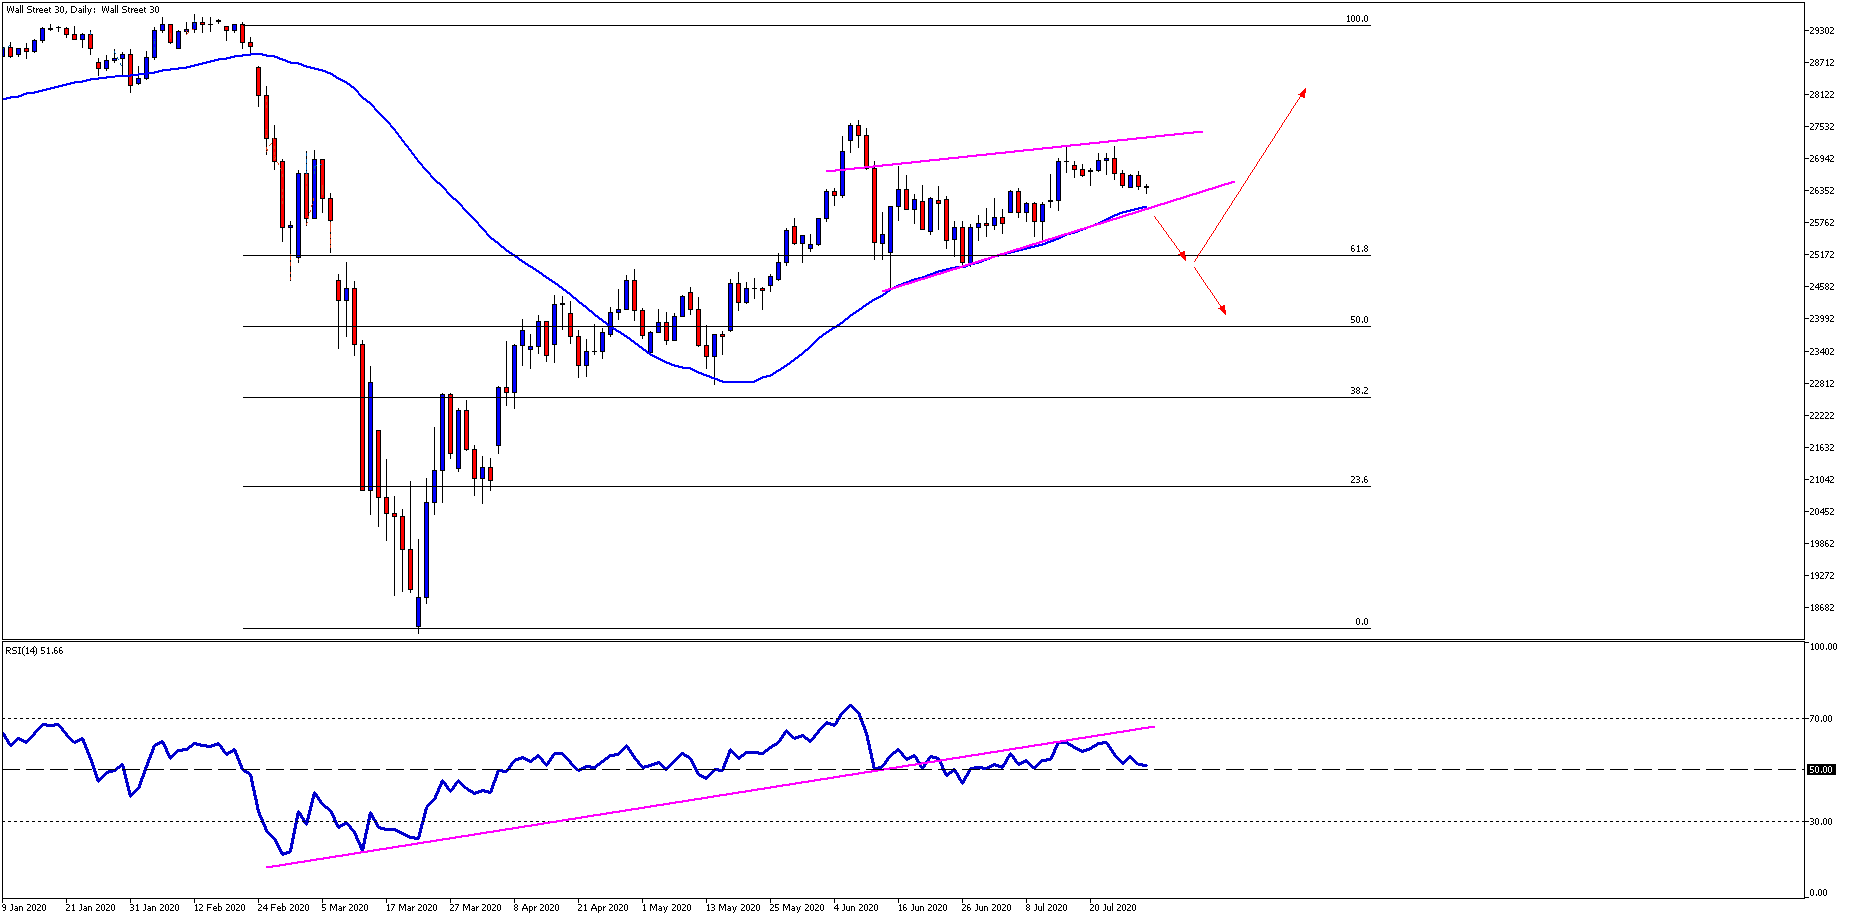
Chart Source: Wall Street 30 Daily Timeframe - GT247 MT5 Trading Platform

Take note: The outlook and levels might change as this outlook is released prior the current day (Wednesday the 29th of July 2020) U.S Market open.
Sources – MetaTrader5, Reuters

Barry Dumas | Market Analyst at GT247.com
Barry has 12 years experience in the financial markets. He enjoys educating clients on trading / investing and providing punchy technical analysis on securities. He currently holds a Wealth Management qualification and is studying towards becoming a Chartered Market Technician® (CMT) designation holder.
Disclaimer:
Any opinions, news, research, reports, analyses, prices, or other information contained within this research is provided by Barry Dumas, Market Analyst at GT247 (Pty) Ltd t/a GT247.com (“GT247.com”) as general market commentary, and does not constitute investment advice for the purposes of the Financial Advisory and Intermediary Services Act, 2002. GT247.com does not warrant the correctness, accuracy, timeliness, reliability or completeness of any information which we receive from third party data providers. You must rely solely upon your own judgment in all aspects of your trading decisions and all trades are made at your own risk. GT247.com and any of its employees will not accept any liability for any direct or indirect loss or damage, including without limitation, any loss of profit, which may arise directly or indirectly from use of or reliance on the market commentary. The content contained within is subject to change at any time without notice.
