


Global markets are optimistic after a strong session on Wall Street which saw all three major U.S Indices higher by the close on Tuesday, despite U.S Treasury yields near multi-year highs.
Investors will be focussed on the U.S CPI data due on Thursday at 15:30 SAST and with January CPI data expected to come in higher than December, market gains could be subdued this week.
U.S 10-year yields could also push to 2% if we see a higher CPI print than expected, which could support the Fed’s 50 basis point rate hike in March. Higher yields could also see a rotation out of growth stocks which are mostly tech driven as investors move capital into value stocks.
Here is what’s expected this week:
The Wall Street 30 Technical Analysis
All three the U.S Indices are expected to remain volatile over the rest of the week with some market participants calling for a rebound from the current market lows.
If seasonality is still anything to go by, we might expect the S&P 500 to start pushing higher until mid-February where we could expect another retracement. We have seen the 50-day simple moving average of price support the price action higher as discussed in our previous WS30 note.
We have noticed that a possible cup and handle technical patter on the Wall Street 30 (WS30) 4H chart which could see price break through the 35635-resistance level. The CPI data, if lower than expected, could be the catalyst to push prices higher to the 36257 price and possible target level.
If the fundamental data does not support a move higher then we could expect the price action to target lower support levels at 35038.
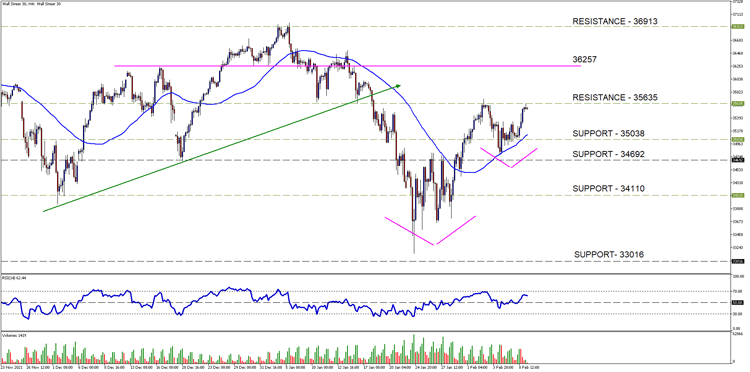
Current State / Chart Source: Wall Street 4H Timeframe - GT247 MT5 Trading Platform

Trading Term of the day:
Cup and Handle
A cup and handle price pattern on a security's price chart is a technical indicator that resembles a cup with a handle, where the cup is in the shape of a "u" and the handle has a slight downward drift. The cup and handle is considered a bullish signal, with the right-hand side of the pattern typically experiencing lower trading volume. The pattern's formation may be as short as seven weeks or as long as 65 weeks. – Investopedia.
Take note: The outlook and levels might change as this outlook is released during the current days (Wednesday the 9th of February 2022) U.S Market open.
Sources – MetaTrader5, Reuters, Xie Yu and Alun John, Investing.com, Investopedia.

Barry Dumas | Market Analyst at GT247.com
Barry has 12 years of experience in the financial markets. He enjoys educating clients on trading / investing and providing punchy technical analysis on securities. He currently holds a Wealth Management qualification and is studying towards becoming a Chartered Market Technician® (CMT) designation holder.
Disclaimer:
Any opinions, news, research, reports, analyses, prices, or other information contained within this research is provided by Barry Dumas, Market Analyst at GT247 (Pty) Ltd t/a GT247.com (“GT247.com”) as general market commentary, and does not constitute investment advice for the purposes of the Financial Advisory and Intermediary Services Act, 2002. GT247.com does not warrant the correctness, accuracy, timeliness, reliability or completeness of any information which we receive from third-party data providers. You must rely solely upon your own judgment in all aspects of your trading decisions and all trades are made at your own risk. GT247.com and any of its employees will not accept any liability for any direct or indirect loss or damage, including without limitation, any loss of profit, which may arise directly or indirectly from the use of or reliance on the market commentary. The content contained within is subject to change at any time without notice.
