


The markets have been gaining momentum over the last two trading sessions ahead of Jobs Friday and even Bitcoin has joined in as China data ease concerns over global growth.
The start to the week saw U.S stocks and Bond yield move higher after Chinese Manufacturing PMI data beat expectations. The data gave investors an indication that the world’s second largest economy might start to stabilize as the manufacturing activity is picking up.
Tuesday morning saw the Asian markets rally once more as global economic slowdown fears start to subside from PMI data. The global Oil market also started pushing higher to new 2019 highs as sanctions and production cuts take effect. The markets might just start to digest the push higher and consolidate until we see direction form the U.S markets.
Last week’s inversion of the yield curve was the topic of hot debate and with all the yields moving higher once more we see some ease return to the markets.
Below the U.S Treasury Yields today:
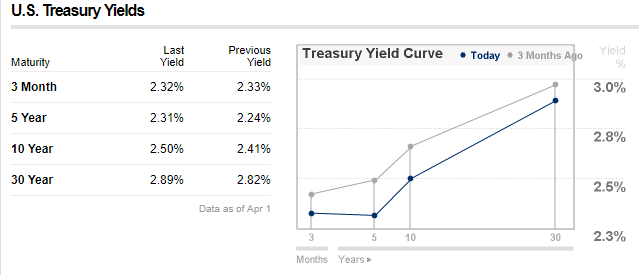
Source – CNN Business
Looking at the chart of Wall Street 30
The price action is currently encountering a major technical resistance area at 26298 which might see the price move lower in the short term Point2. before pushing higher as seen in Point 1.
Some technical and fundamental points to look out for:
- The price action is still well above its major moving averages which supports the move higher moving forward.
- Ascending Triangle pattern forming on the wall Street 30 which might support a breakout from the 26298-resistance level.
- The Boeing Company (BA) will be watched closely for news filtering through which might affect the share price as BA is the major constituent in the Index.
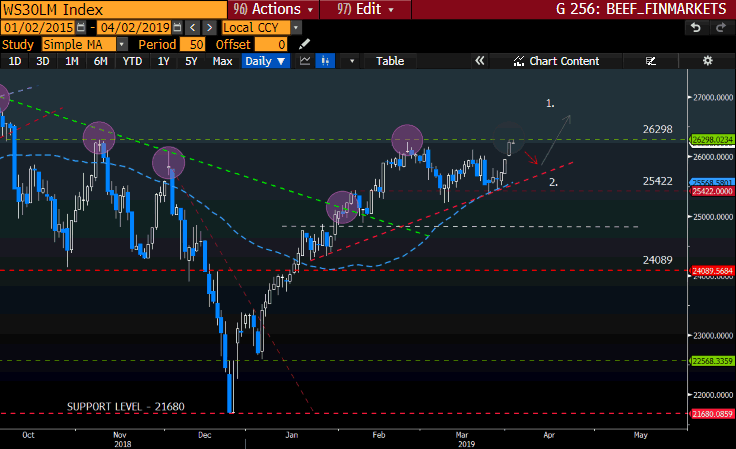
Source – Bloomberg
Looking at the chart of the S&P 500
The S&P 500 has also seen some momentum over the last two trading days and is also heading for major resistance at the 2881 level. The price action might consolidate between the 2881 resistance and 2816 support level before another leg higher.
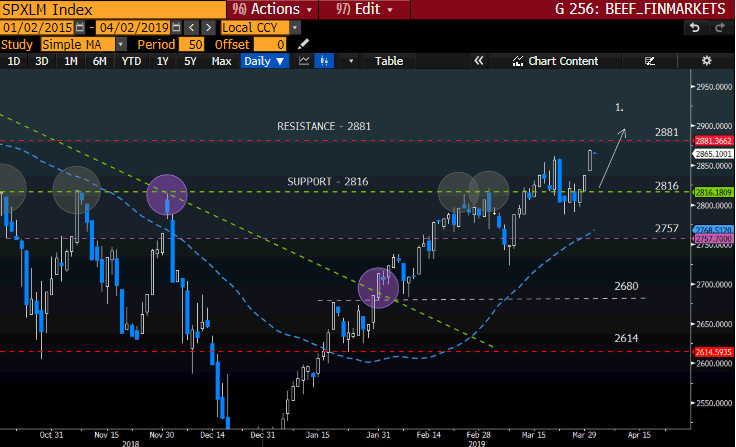
Source – Bloomberg
Looking at the chart of the Nasdaq 100
The Nasdaq has gained over 2% in the last 5 trading days and might be set to push even higher. The Tech sector has been on the rebound from the selloff we saw late last year and gaining over 17% year-to-date. The 7500 technical resistance level will be watched closely as we might see a push higher from this level to 7687.
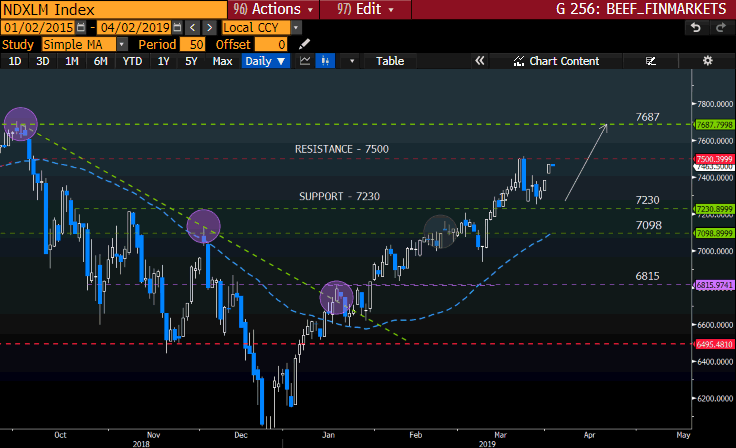
Source – Bloomberg
May your trading day be profitable!
Disclaimer:
Any opinions, news, research, reports, analyses, prices, or other information contained within this research is provided by Barry Dumas, Market Analyst at GT247 (Pty) Ltd t/a GT247.com (“GT247.com”) as general market commentary, and does not constitute investment advice for the purposes of the Financial Advisory and Intermediary Services Act, 2002. GT247.com does not warrant the correctness, accuracy, timeliness, reliability or completeness of any information which we receive from third party data providers. You must rely solely upon your own judgment in all aspects of your trading decisions and all trades are made at your own risk. GT247.com and any of its employees will not accept any liability for any direct or indirect loss or damage, including without limitation, any loss of profit, which may arise directly or indirectly from use of or reliance on the market commentary. The content contained within is subject to change at any time without notice.
