


It seems that global economic growth concerns have reared its ugly head once more as the International Monetary Fund (IMF) reports all is not well in the world.
The U.S
The IMF has warned that President Trump’s statements and plans around the FED might lead to the undermining the central banks independence. The Fed released its interest rate meeting minutes yesterday and it shows that the FED is willing to be patient and flexible with future rate decisions.
Looking at the chart of the S&P 500
The S&P 500 has been pushing upward making higher highs and higher lows which is a sign that the trend is in tact to the upside.
Some technical points to look out for:
- The price action might consolidate above 2872 as the market digests the current state of the economy and will be watched closely.
- The S&P is still trading well above all the major moving averages and above its 50-day Simple Moving Average (blue dotted).
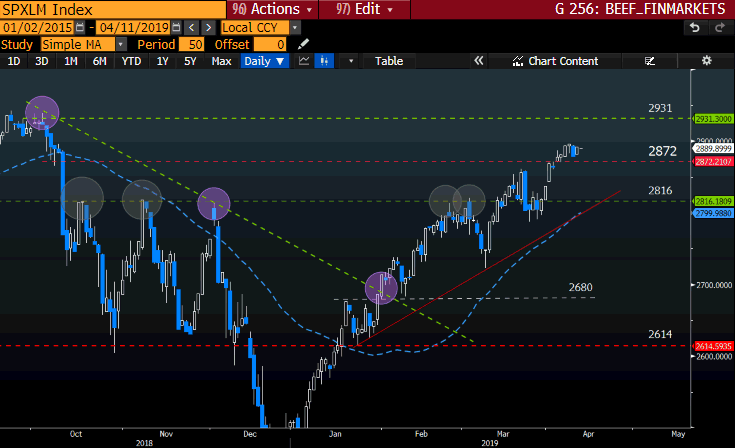
Source – Bloomberg
Germany
The European Central Bank (ECB) left interest rates unchanged yesterday as ECB President Draghi warns of downside risks to the Eurozone. President Trump’s trade threats and Brexit confusion along with Italy’s fiscal uncertainty are some of the main issues impacting growth sentiment. The German 10-year Treasury Bond Yield also dropped along with the Euro as Draghi shares the ECB’s growth outlook.
Looking at the chart of the Dax
Germany, the Eurozone’s largest economy has weakened considerably over the past couple of quarters and is of concern to the ECB.
Some technical points to look out for:
- We might see the index under pressure if the Technical support level at 11831 does not hold, this level is the broader head and Shoulders pattern’s neckline.
- The price action is still above its 50-day Simple Moving Average which supports the move higher and will be watched closely.
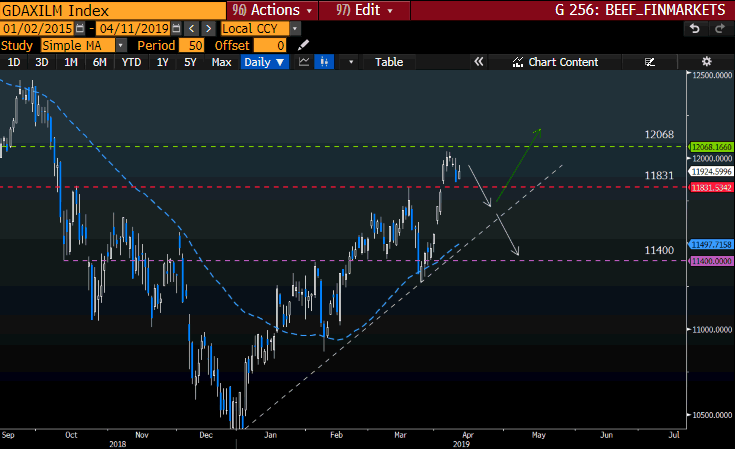
Source – Bloomberg
South Africa
The International Monetary Fund (IMF) has lowered the economic growth rate to 1.2% in 2019 from 1.4% which has put SA in amongst the worst performers in Sub-Saharan Africa. The silver lining is that it is above the 0.8% expansion the local economy saw in 2018. yesterday.
Looking at the chart of the Alsi
The Rand (ZAR) has gained some ground against the U.S Dollar (USD) which added to the upward momentum in the Index along with Naspers rise in momentum.
Some technical points to look out for:
- The Index broke through the 52395 Technical Resistance level and might see the price move lower to retest this level.
- Price action is well above its medium-term moving average the 50-day Simple Moving Average (blue dotted).
- A close eye will be kept on the local currency and if the Rand (ZAR) continues to strengthen against the Greenback we might expect the Alsi to push higher.
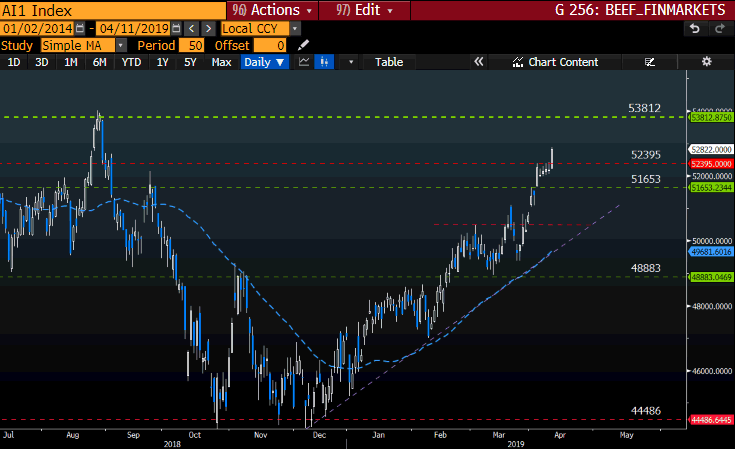
Source – Bloomberg
Disclaimer:
Any opinions, news, research, reports, analyses, prices, or other information contained within this research is provided by Barry Dumas, Market Analyst at GT247 (Pty) Ltd t/a GT247.com (“GT247.com”) as general market commentary, and does not constitute investment advice for the purposes of the Financial Advisory and Intermediary Services Act, 2002. GT247.com does not warrant the correctness, accuracy, timeliness, reliability or completeness of any information which we receive from third party data providers. You must rely solely upon your own judgment in all aspects of your trading decisions and all trades are made at your own risk. GT247.com and any of its employees will not accept any liability for any direct or indirect loss or damage, including without limitation, any loss of profit, which may arise directly or indirectly from use of or reliance on the market commentary. The content contained within is subject to change at any time without notice.
