


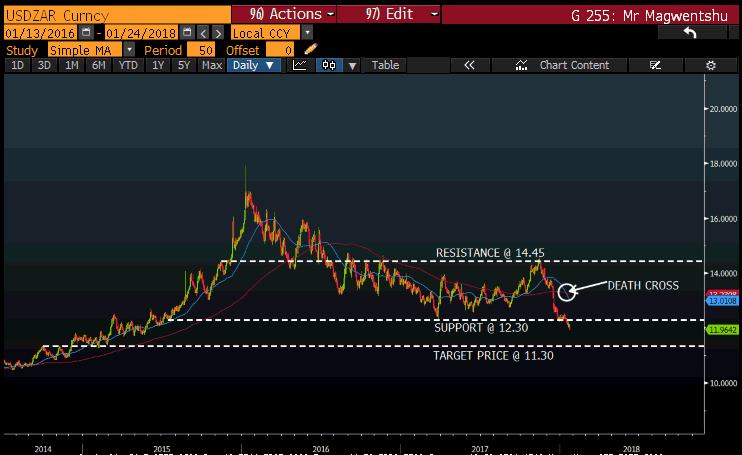
In recent days we have seen the Rand take strides and strengthen against the major currencies but more so against the US dollar, which has been losing value too. In today’s trading notes I am looking firstly at stocks that co-relate to the crosses movement. Please note that the 50 day Moving average has gone below the 200 day Moving Average also known as the ‘Death Cross’. $FSR is one of the shares that I am looking at, as since the beginning of the week the stock has been reaching all-time highs and showing momentum. Rand hedges on the other hand have been struggling and have pulled back as the local unit advances against the dollar.
Want to trade the ZAR? Click HERE.
Here are two Technical Trade Notes you can look at...
1. First Rand Trade Summary
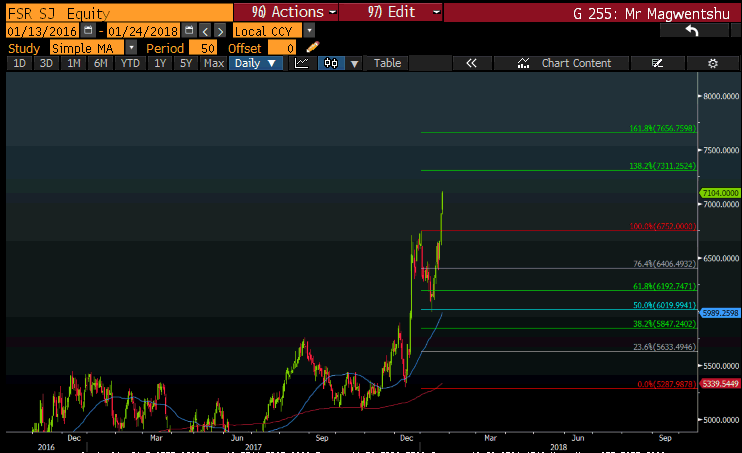
Trade summary: Long FSR
Entry: 7000c
Stop Loss: 6406c
Target price: 7656c
As previously stated above, the momentum of the rand has seen a solid run in the banking shares as sentiment towards investing in the country gains traction. The election of Cyril Ramaposa as President of the ruling party in December 2017 has seen a resurgence in SA shares. Within this time, we have also seen the yield in the 10-year government bonds soften to 8.38%, the correlation between the local banking index and the 10-year government bonds is illustrated in the graph below.
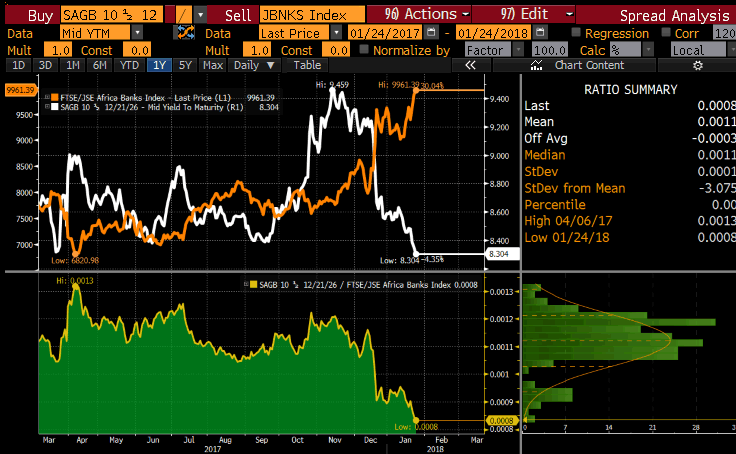
Banks generally have a positive correlation with the 10year government bond. By the looks of things, the yield is going below the support line (8.43%) and this will confirm my trade for $FSR. If the yield on government bonds decreases, it essentially means that investors will get a lower return for their money and this in turn will increase margins for banks.
Above I have illustrated the relationship of the JBNKS index to the RSA 10-year bond. If we look at the movement of the JBNKS index (orange line) we can see that the index has advanced higher. In the same reference period, the 10-year bond (the white line) has come lower, which has essentially given rise to the banking stocks. The JBNKS index is made up of the 6 largest banks listed on the JSE measured by market capitalisation.
2. Richmont Trade Summary
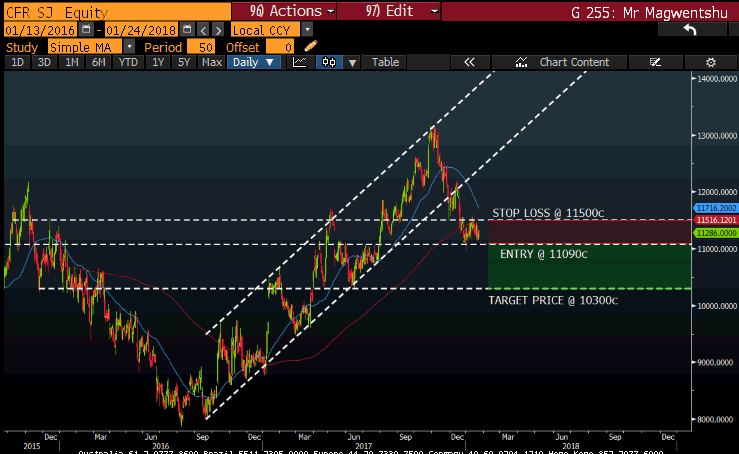
Trade summary: Short CFR
Entry: 11090c
Stop Loss: 11500c
Target price: 10300c
$CFR is one of the well-known Rand hedge stocks on the JSE and the share price has been struggling in recent months and broke out of the upward channel in November last year. It has been consolidating between 11500c and 11090c since early December to date and should the Rand continue its current course, a short position on the stock would seem lucrative with a target price at 10300c.
