


Crude Oil’s slide from the October 2018 highs into a bear market has had absolutely no negative impact on the big Oil companies as one would expect. As earning season is upon us it was not expected by analysts that the three major Oil companies Shell, ExxonMobil and Chevron would beat expectations.
Let's take a closer look at the technicals...
- The three major Oil companies posted Q4 earning as well as exceeding market analysts’ expectations with some earnings at its highest level since 2014. Which just goes to show that these Oil companies have learned how to raise profits when the price of Oil is well below $100/ barrel.
Saudi Arabia and some Organization of the Petroleum Exporting Countries (OPEC) members formed a coalition with Russia, the world third largest oil producer and is now seeking a permanent agreement for three more years. The coalition was formed back in 2016 in a bid to stop the downward spiral of the Oil price by cutting output.
- Russia has pushed back on the idea as it is better positioned to balance its budget at current levels than Saudi Arabia, which needs Brent prices at about $73 a barrel to break even according to the International Monetary Fund.
Looking at the chart of Brent Crude Oil:
Brent Crude Oil has been consolidating sideways since the start of January 2019 and is waiting on fundamental direction. The price action has broken out of the descending channel and has formed a Inverse Head & Shoulders (H&S) Technical pattern. I am currently waiting on the fundamentals (OPEC, Russia) news to give some direction and to support the pattern playing out.
- We need to see the price action move higher and preferably close above the $64/ barrel level which coincides with the 38.2 Fibonacci Retracement level.
- Our target price would be the $68/barrel as a first target price which is firmly halfway at the 50% Fibonacci Retracement.
- If the 23.6 Fib level which acts as support does not hold, then we might see the price action move lower to $55.79/ barrel. Then the H&S Technical pattern would be negated and no longer relevant.
- Currently the 50-day Simple Moving Average (Blue line) is still supporting the price action to move higher.
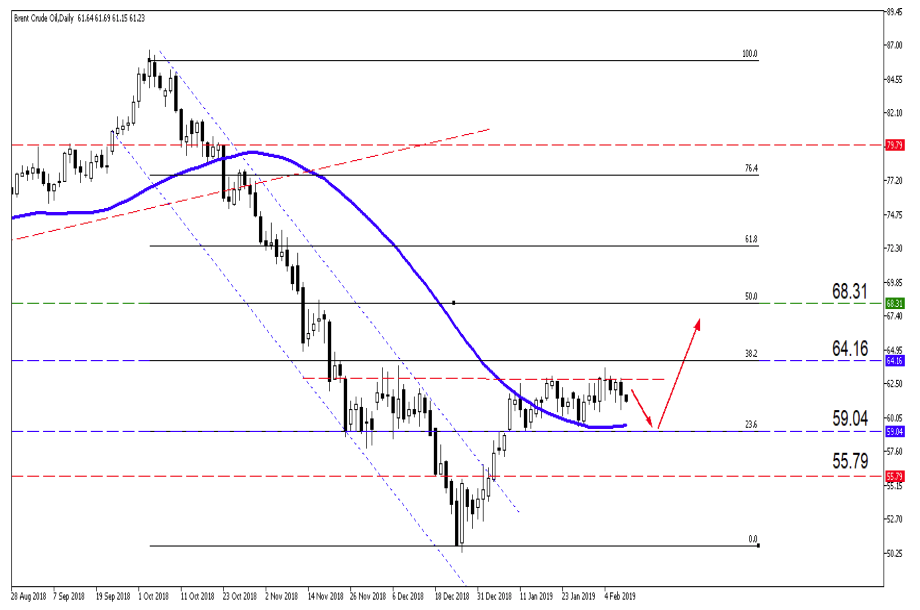
Source – MetaTrader5

Disclaimer: Any opinions, news, research, analyses, prices, or other information contained within this research is provided as general market commentary, and does not constitute investment advice. GT247.com will not accept liability for any loss or damage, including without limitation to, any loss of profit, which may arise directly or indirectly from use of or reliance on such information. The content contained within is subject to change at any time without notice, and is provided for the sole purpose of assisting traders to make independent investment decisions.
