


Oil
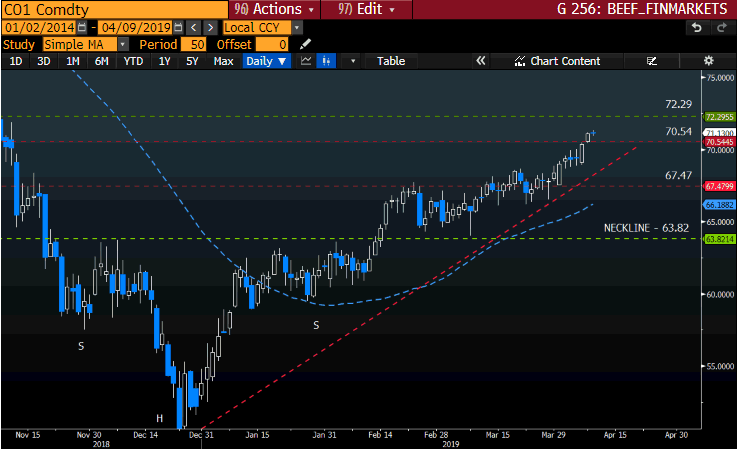
Crude Oil has made the headlines once more at the start to the trading week as Brent Crude Oil and WTI Light Crude Oil reached highs last seen in November 2018.
The main drivers to the rise in Oil can be attributed to the ongoing Organization of the Petroleum Exporting Countries (OPEC) supply cuts plus U.S sanctions on Venezuela and Iran. The supply cuts by OPEC along with non-affiliated allies like Russia have pledged to cut the supply of around 1.2 million barrels per day in 2019.
U.S Crude has gained over 13% over the last month with Brent Crude at its new 5 month high as conflicts in Libya continue.
Crude Oil Inventories will also be watched closely this week to see when the supply cuts will take effect in the market. Analyst forecast for the week is there might be another build in inventories of around 2.5 million barrels which will be released on Wednesday 16:30 SAST.
Looking at a chart of Brent Crude Oil and taking the seasonality into account for the month of April, Brent usually rises around 5%. With the current gains we might see Brent Crude Oil retrace from current levels before it pushes higher to the $72/ barrel Technical level.
Source – Bloomberg.
South Africa (Petrol price)
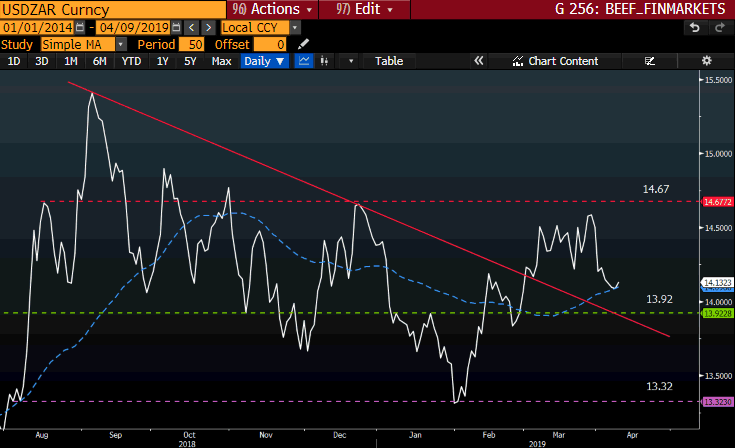
Are we going to see another Petrol price increase next month? Well the possibility is very likely if Brent Crude Oil continues to rise. The other factor to look at would be the Rand (ZAR), the local currency has been under pressure of late but has managed to claw back over 3% against the Dollar (USD) since March. A Petrol price increase might be likely if the Rand (ZAR) also starts to lose ground against the greenback over the rest of April.
Source – Bloomberg
Gold
Gold prices have been rising as the Dollar (USD) starts to move lower mainly from the recent data which showed a slowing in U.S wage growth. The recent rally in stocks have also put a damper on the precious metal but with the greenback lower gold might be an attractive asset for investors.
Central bank data showed that China increased its Gold reserves by 0.6% by the end of March as political unrest in Libya might add to global concerns.
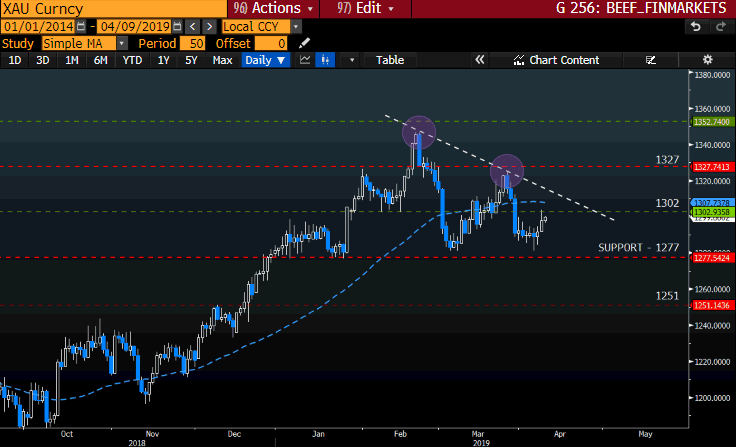
Looking at the chart of Gold (XAU) we can see that the price action is forming lower peaks (purple circle) as the price moved lower since February.
Some technical factors to look out for:
- A well-defined technical support line should also be watched at $ 1277/ oz as a break in support might see the price move lower to $ 1251/ oz.
- The 50-day Simple Moving Average (blue dotted) is also above the current price action which supports a move lower.
- We would need to see the price action move above the $1327/ oz level which would act as technical resistance to see a change in momentum.
Source – Bloomberg.
Palladium
Palladium has seen its stellar run come to an end with some asking the question has the “Bubble Burst” on the precious metal? Some analysts are still bullish on the metal if demand out ways supply to the automobile manufacturing industry which was one of the main drivers.
This might not be the case anymore as the rise in Platinum has Analysts speculating that automobile manufacturers may be at a point of substituting Palladium with Platinum. Manly since both metals are used in the converters and that Platinum comes at a lower price.
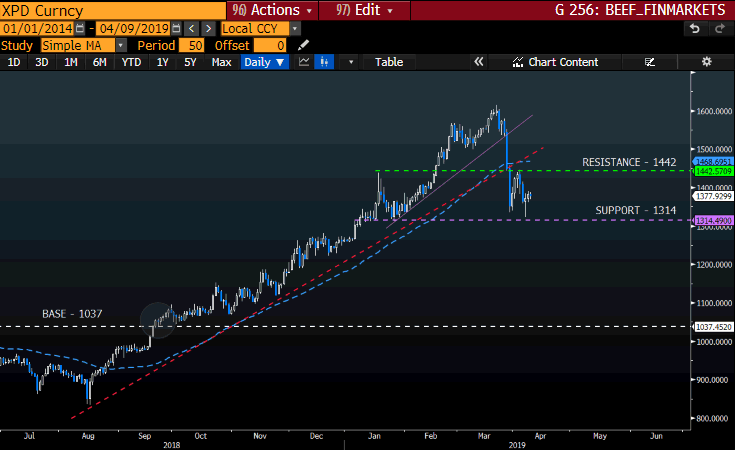
Some technical factors to look out for:
- Looking at the chart of Palladium, if we see the Technical support line at $1314/ oz break then we might call for a “bubble” scenario which would see the price move significantly lower.
- Palladium is also trading below its 50-day Simple Moving Average (blue dotted) which supports the move lower.
- For the Bulls to take charge we would need to see the price cross the $ 1442/ oz Technical resistance to support any move higher.
Source – Bloomberg
Disclaimer:
Any opinions, news, research, reports, analyses, prices, or other information contained within this research is provided by Barry Dumas, Market Analyst at GT247 (Pty) Ltd t/a GT247.com (“GT247.com”) as general market commentary, and does not constitute investment advice for the purposes of the Financial Advisory and Intermediary Services Act, 2002. GT247.com does not warrant the correctness, accuracy, timeliness, reliability or completeness of any information which we receive from third party data providers. You must rely solely upon your own judgment in all aspects of your trading decisions and all trades are made at your own risk. GT247.com and any of its employees will not accept any liability for any direct or indirect loss or damage, including without limitation, any loss of profit, which may arise directly or indirectly from use of or reliance on the market commentary. The content contained within is subject to change at any time without notice.
