Cable and Satellite Media
Naspers/Tencent
“Tencent dog still wagging the Naspers tail”
NPN share price ZAR: R2,870
NPN net shares in issue: 432,1 million
NPN market cap ZAR: R1 240 million ($83,5 billion)
700:HK share price: HK$293
700:HK net shares in issue: 9,5 billion
700:HK market cap HK$ 2,8 trillion ($356 billion)
Trading Buy and Portfolio Buy

Despite announcing the MultiChoice unbundling and separate listing, the market is not giving Naspers any unlock benefit and so the Tencent dog continues to wag the Naspers tail from a valuation point of view.
There remains a stubborn negative difference between the see-through-value of the Tencent investment R1 652 billion and the Naspers market capitalisation of R1,240 billion, which is a 25% variation. The remainder of the assets within Naspers are worthless on this basis.
The above is calculated on the Chinese yuan at CN¥6,92/$, the Hong Kong dollar at HK$7,83/$, the rand at R14,86/$, the price of Tencent at HK$293, and Naspers at R2,870.
Tencent has been sliding this year, down 28.5% in Hong Kong dollar at the current share price of HK$293. Naspers is also down by around 20% year to date at R2,870 per share. However, measured in US dollar your Naspers investment has lost 34% of its value year-to-date.
The discount to the see though value on Tencent has remained in the 25% to 30% range and shows no sign of closing. Therefore, Tencent continues to be the benchmark against which traders in Naspers should gauge their exposure, leaving aside currency.
Tencent has been caught up in the downward China vortex. The Shanghai Stock Exchange SSE Composite Index is down 33% year to date and the FTSE China A50 Index is off 5% since the beginning of October. The Hang Seng is down 13% year to date.
However, sentiment frequently diverges from business fundamentals. Tencent is in s sound financial position. The balance sheet is strong. Shareholders’ equity is estimated at CN¥350 billion by year end and I estimate year end net cash of CN¥50 billion.
What was interesting about the 400-page US listing prospectus in Tencent Music Entertainment Group, which gives investors detail on a previously little-known part of Tencent, is the strength of the cash flow and profitability in this business too. The parent Tencent owns 58.1% of Tencent Music Entertainment, with Spotify holding 9.1% and the directors and executives holding 8.4%.
At HK293, Tencent is now on a forward PE ratio of 31,2x on projected 2018 earnings and 24,4x on 2019 earnings. The three-year PEG ratio is only 1,7x, lower than several JSE listed retailers. Tencent is thus the cheapest it has been for a long time.
Non-GAAP EPS for F2018 is projected at CN¥8,30, up 21,5%, increasing to CN¥10,60 in F2019, up 27,7%, and then CN¥12,50 in F2020, up 18%. I have three-year compound EPS growth at 22%.
On a trading basis a narrowing discount to Tencent tends to be a signal to sell with a widening discount a time to buy. At this time Naspers though looks range bound within the discount range of 25% to 30%. With Tencent at levels that take us back to mid-2017, pricing is starting to look interesting for new money in this stock and thus Naspers will benefit on the upside with a turn in sentiment.
Mark N Ingham
Technical Analysis by Barry Dumas
Naspers has returned to the spotlight of late as the company announced the unbundling and separate listing of MultiChoice. One would think that would be received positively by the market, but it still seems that Tencent (0700.HK) is still dictating the direction of Naspers.
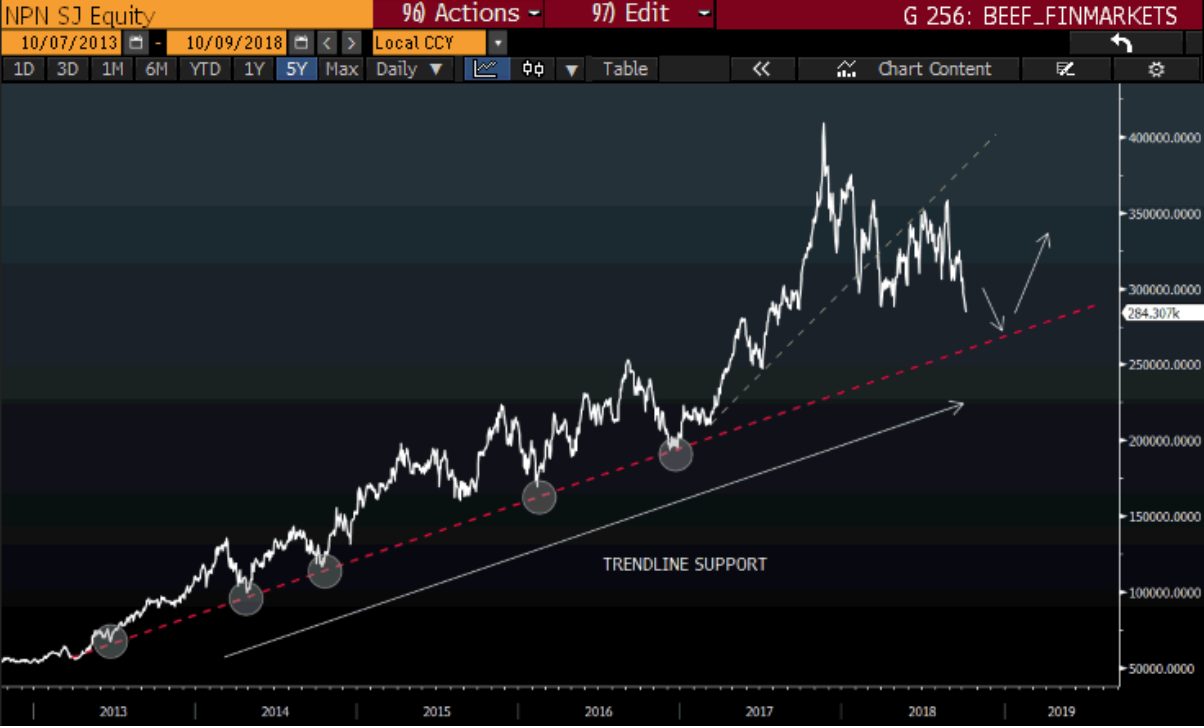
Looking at the broader picture we can see the price action has been moving in a steady uptrend since 2013. The price action has been finding support at the trend support line (red dotted) and moved higher from there over the years. The price action is heading back to the same trend-line and if history repeats itself we should see the price move higher from there.

Chart Source: Bloomberg
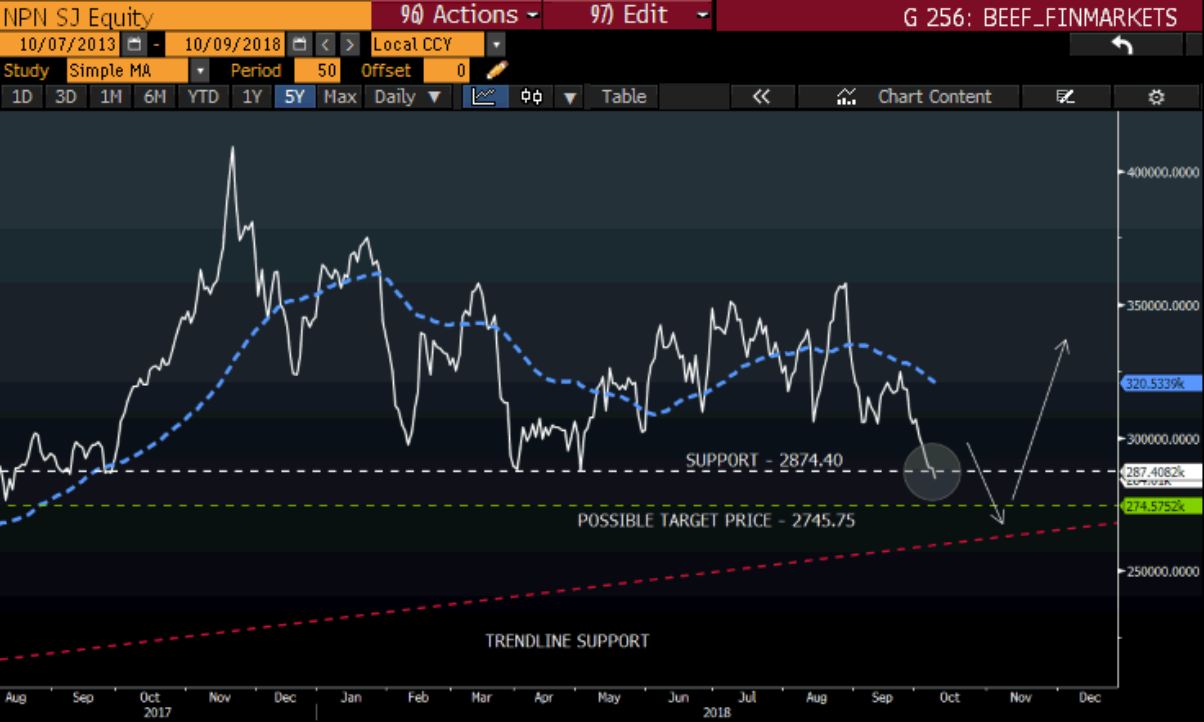
Taking a closer look at the chart below we can see that the price has found support at R2874.40 per share over the last couple of months and is currently moving lower. The price action is also trading well below the 50-day simple moving average (blue dotted) which supports the move lower. A possible target price would be around R2745.75 per share before we see the price move higher.

Source – Bloomberg
READ: How to read a fundamental analysis
Disclaimer: Any opinions, news, research, analyses, prices, or other information contained within this research is provided as general market commentary, and does not constitute investment advice. GT247.com will not accept liability for any loss or damage, including without limitation to, any loss of profit, which may arise directly or indirectly from use of or reliance on such information. The content contained within is subject to change at any time without notice, and is provided for the sole purpose of assisting traders to make independent investment decisions.


