


Trade note on AUD/USD 16 July 2018
If we see weakness coming through on the Dollar index (DXY) from current levels we might just see the AUD/USD currency pair move higher from the 0.7448 level.
Dollar index (DXY)
The Dollar Index (DXY) might just see more weakness filtering through this week as shown in the chart below to a first target level of 94.20. If the price action does not move lower from this level we might just see the price reverse higher which will negate our long trade on AUD/USD.
In this note, I detail the technicals on the chart and the trade summary.
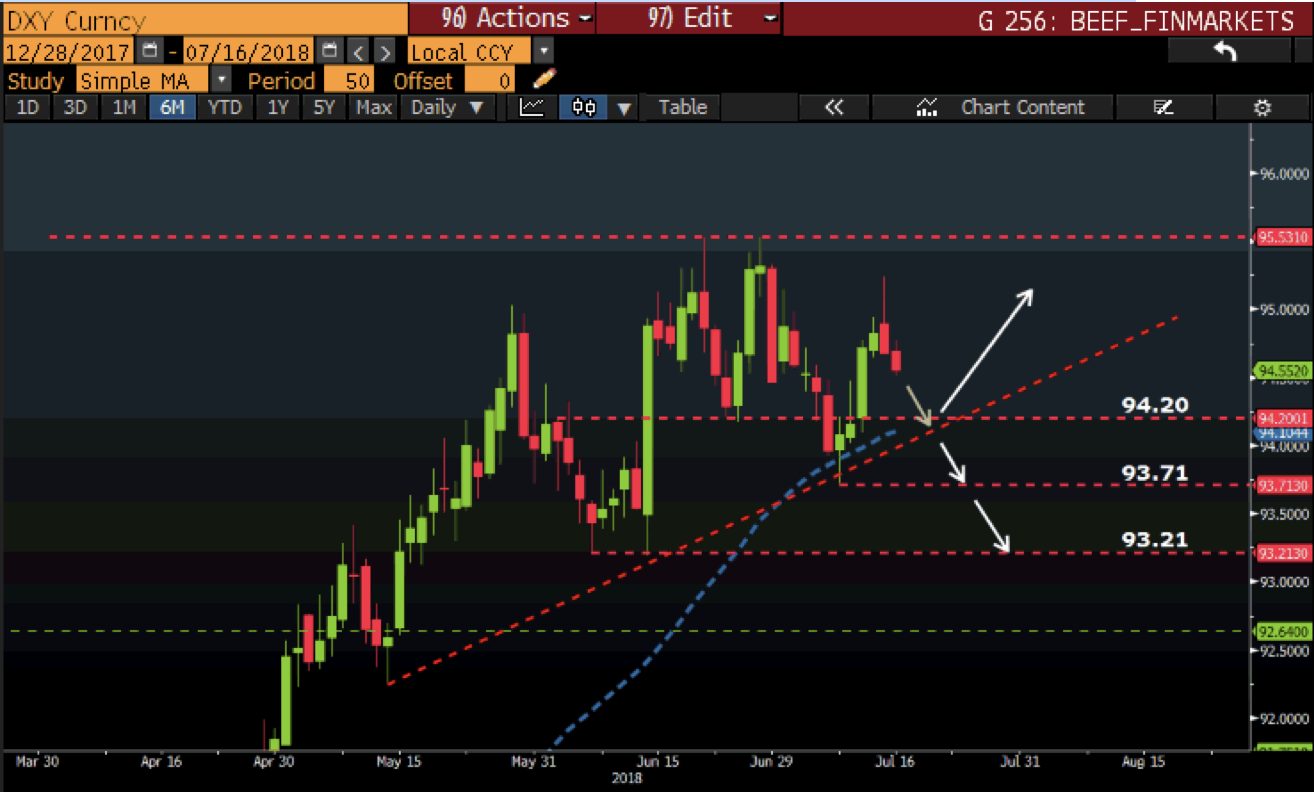
Source: Bloomberg
Technical outlook: looking at the 4-hour (H4) time frame we see the price action trading higher than the 50-day simple moving average (SMA) which might give some support to the price action moving higher. We need a break through the 0.7443 level and preferably a daily close above this level to confirm the move higher. On the daily time frame, it looks like an inverse head and shoulders (IHS) technical pattern has formed and is currently testing the neckline for a break higher.
Trade: AUD/USD
- Entry (Buy): 0.7448
- Stop loss: 0.7374
- Target Price 1: 0.7513
- Target price 2: 0.7567
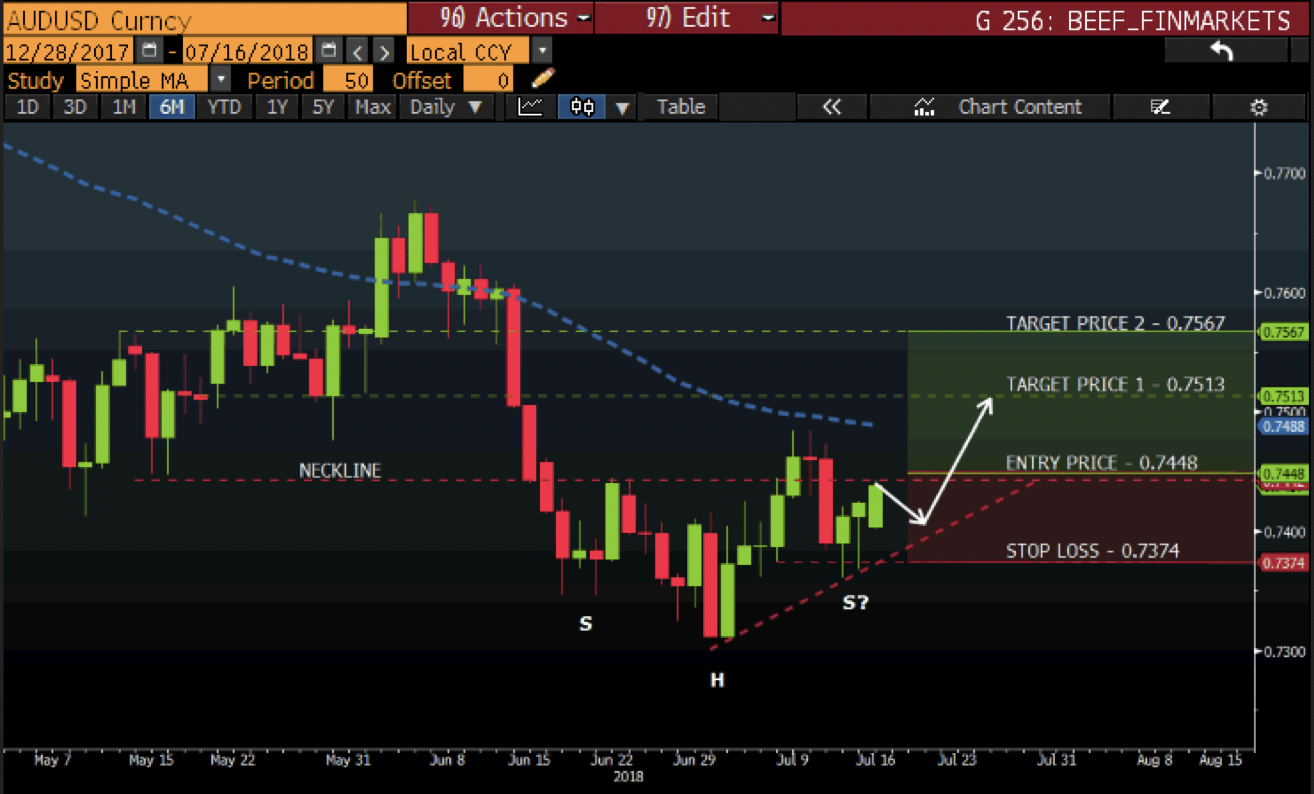
Source: Bloomberg

*End

Disclaimer: Any opinions, news, research, analyses, prices, or other information contained within this research is provided as general market commentary, and does not constitute investment advice. GT247.com will not accept liability for any loss or damage, including without limitation to, any loss of profit, which may arise directly or indirectly from use of or reliance on such information. The content contained within is subject to change at any time without notice, and is provided for the sole purpose of assisting traders to make independent investment decisions.
