S&P 500 Due for Correction - Technical Take
By Technical Analyst Colin Abrams
Recommendation: LOOK TO SELL SHORT
Current Trend: Short-term up but overbought. Med and long-term up.
Strategy: Sell short on the next reversal day/candle down, with caution.
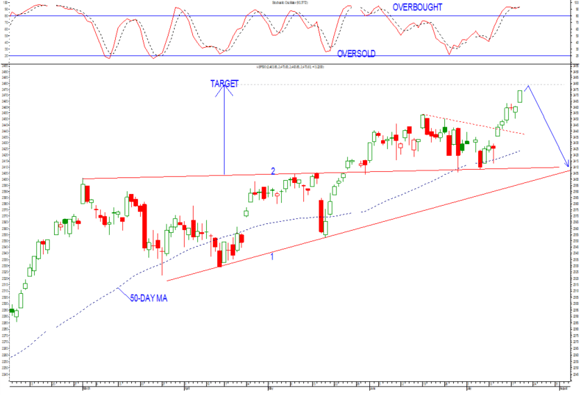
(Daily Chart S&P500 Index)

Chart Setup: The S&P is looking like another day or two up at most and then a sizeable correction to come (as drawn in).
- Its short-term Stochastic is overbought, so the chance of a correction is becoming high.
Strategy Details: Sell short on the next reversal day/candle down (which could happen at any time). Keep in mind this trade is fairly aggressive because it’s counter-trend, so caution advised.
Target: While there is still a higher target to 2479 based on the height of triangle 1-2 projected up, I'm not too sure it will be reached exactly. To the downside, support is line 2 at 2409. Take at least half profits near there. Further support is line 1 at 2400 for remaining profits on shorts.
Stop-loss: For a new short trade it will be a close above the high of the reversal day down/current rally. From 2433 lower the stop to a breaking of its prior two-day high; then prior one-day high from 2423.
Wishing you profitable trading until next time.
Colin Abrams

Disclaimer: Any opinions, news, research, analyses, prices, or other information contained within this research is provided as general market commentary, and does not constitute investment advice. GT247.com will not accept liability for any loss or damage, including without limitation to, any loss of profit, which may arise directly or indirectly from use of or reliance on such information. The content contained within is subject to change at any time without notice, and is provided for the sole purpose of assisting traders to make independent investment decisions.
GT247.com: +27 87 940 6101
IT support & help desk: +27 87 940 6107
Client relations (new accounts): +27 87 940 6106
Sales: +27 87 940 6108


