


Markets Power Ahead, A Blowoff Top? - Technical Take
By Technical Analyst Colin Abrams
Introduction:
Despite the local and overseas market being very overbought they both continue to move higher, with the JSE All Share index rally powering up sharply. A host of bearish reversal candles in recent days have been totally ignored, and that is a sign if real strength. It seems like the index wants to make/test its all time high before selling off. Either way, this doesn't change the fact that world markets are dangerously high. A correction can still start at anytime, but because we’re heading into month-end, they’ll probably hold up until then.
The S&P 500 is now reaching its upside target of 2479. I still believe it’s living on borrowed time. The JSE All Share index chart is not far from its all time high, but shows numerous bearish signs developing as shown here. The JSE findi 30 (financial and industrial) index is testing its all time high and is overbought. On the currency front the EUR/USD is reversing down from long-term resistance for shorting the euro. Stock charts shown are Gfields (building up for a breakout), Discovery (higher target still) and Telkom (shortable).
Overall, the market is defying the odds right now by continuing higher. It can still go a bit further but remains dangerously high. Short-term traders should be careful not to get sucked in right at the top. My view remains one of great caution, with a view to potentially shorting the main indices locally and oversees for a correction. Thereafter we’ll be looking for long signals again.
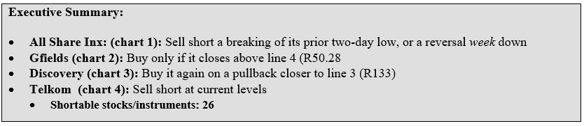
JSE ALL SHARE INDEX – All time high in sight
[Signals done on alsi future]
Recommendation: LOOK TO SELL SHORT (WITH CAUTION)
Current Trend: Short-term up but overbought. Med and long-term sideways.
Strategy: Sell short a breaking of its prior two-day low, or a reversal week down (more conservative).
Chart 1. (Daily)
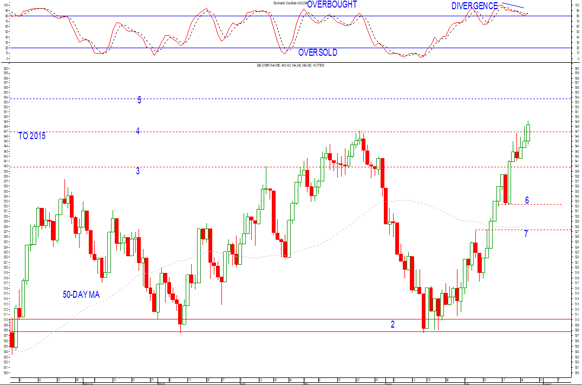
Chart Setup: The All Share index gave a classic reversal candle down on Friday from line 4. On Tuesday we got another classic reversal candle down. However neither candle has had its low broken to trigger the short entry. [Remember it has to break the low of a reversal day down to trigger the entry; and vice versa for a reversal day up. A reversal day/candle on its own is not reliable enough]. We are seeing a preponderance of bearish candles though and this points to a sell-off to come.
- Its daily Stochastic (on top) is overbought and is giving a negative divergence, waring of the correction to come.
Strategy Details: Sell it short on an intraday break of its prior two-day low, given that we have bearish reversal candles. As mentioned last week, this is still a fairly aggressive signal because it’s against the trend. A reversal week down will be the more conservative entry. (Another option is a close below the previous day’s low).
Target: To line 6 support at 53 250. Take half profits there. Further potential to line 7 at the 52 800 level for taking remaining profits. To the upside resistance is still line 4 (54 680/54 700), then its all time high at line 5 (55 355).
Stop-loss: A close above the high of the current rally. From 53 500 lower the stop to a breaking of its prior two-day high. Then prior one-day high from 52 800.

GFIELDS – Breakout attempt
Recommendation: BUY
Current Trend: Short-term up. Med-term sideways. Long-term down.
Strategy: Buy an intraday break above R50.50.
Chart 2. (Daily)
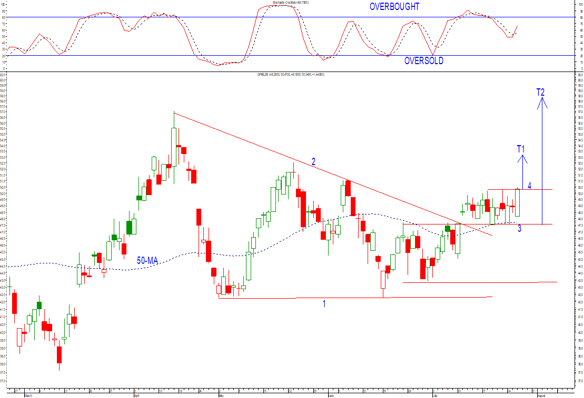
Chart Setup: Interestingly Gfields is doing very well relative to the other gold stocks, and has been moving up since mid-June. It’s moved sideways over the past two weeks in a small channel (lines 3 and 4), and looks to be waiting for reason to go higher. In fact yesterday it closed slightly above line 4. I'm looking for follow through here. The current move has also taken it above line 2 of a large triangle.
- Its short-term Stochastic has pulled back and is turning up again, which is potentially bullish.
Strategy Details: Buy an intraday break above R50.50 (above yesterdays high).
Target: If we get that breakout the initial target (T1) is R53.20 i.e. the height of channel 3-4 projected up. Short-term traders can take some profits there. That move will also activate a higher target (T2) to R58.20, based on triangle 1-2 projected up.
Stop-loss: Initial stop is a close below line 3 (below R47.50). From R53.20 take partial profits and bring the stop up to a close below R49.50 on the remainder. From R56.80 raise the stop to a breaking of its prior two-day low.
DISCOVERY – Higher target in place
Recommendation: BUY AGAIN LOWER DOWN
Current Trend: Short-term up. Med and long-term sideways to up.
Strategy: Buy it again on a pullback closer to line 3 (R133).
Chart 3. (Daily)
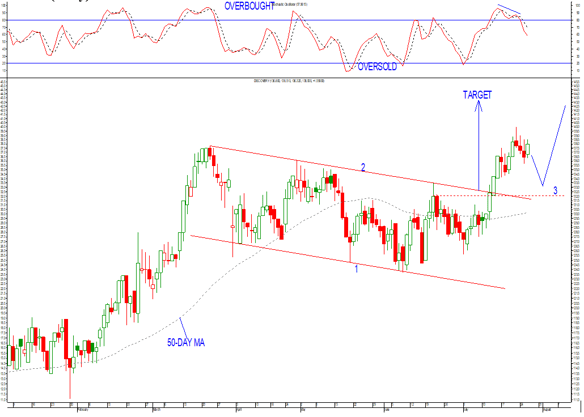
Chart Setup: Discovery has so far reached two of our three upside targets given here recently. The trailing stop (prior two-day low) locked in remaining profits this week. While it rallied yesterday I would like to see more of a pullback before buying again. There is still a higher target based on channel 1-2.
- Its short-term Stochastic is pulling back from an overbought level after giving a negative divergence. That’s why I would want to see more pullback to buy.
Strategy Details: Buy it lower down e.g. closer to line 3 (R133) (on a reversal day/candle up).
Target: Up to R143.00 i.e. the height of channel 1-2 projected up.
Stop-loss: A close below R132.00. Once it trades back above last weeks high i.e. above R140 raise your stop to breakeven (entry price). Then from 141.50 raise it again to a breaking of its prior two-day low.
TELKOM – Vulnerable to a sell-off again
Recommendation: SELL SHORT
Current Trend: Short-term sideways. Med-term down. Long-term sideways.
Strategy: Sell short an intraday break below R63.60, or from R66 – whichever happens first.
Chart 4. (Daily)
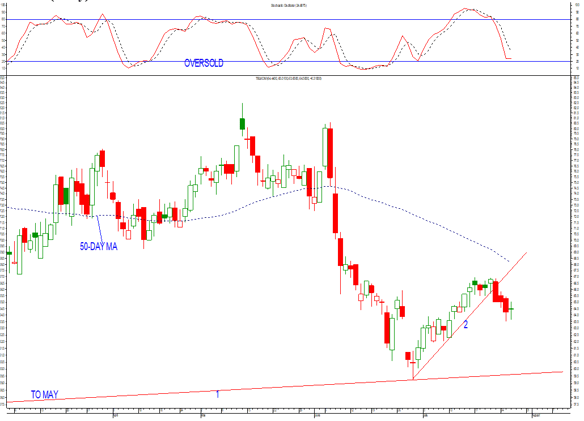
Chart Setup: After giving a recent relief rally, Telkom has broken down below line 2 support and looks to be heading lower.
- Its short-term Stochastic can still drop further even though it’s nearing its oversold zone. I'm viewing its recent rally as a bounce in a downtrend.
Strategy Details: Sell short either an intraday break below R63.60 (below yesterdays low), or from R66. Do whichever happens first
Target: Down to line 1 at R59.70. Take partial profits at R60.20 though.
Stop-loss: A close above R70.00. Expect some support at R62.30 on the way down. From R61.40 lower the stop to a breaking of its prior two-day high.
UPDATE OF LAST WEEK’S STOCK CHARTS:
- Resilient: Target is 135. Initial stop is a close below 122.00 still. From 133 bring the stop up to breakeven (your entry), and from 134 raise it again to a breaking of its prior two-day low.
- Pick ‘n Pay: triggered the buy signal. It’s a hold, but with caution because it quite overbought right now. Upside target is still R68.00 based on the inverse H/Sh. But take half profits at 66.00, where there is some resistance. Stop is a close below 58.00. Once it gets to 64 move the stop up to a close below 60.50. From 66 take half profits and raise the stop again to a breaking of its prior two-day low.
- Sasol: it triggered the intraday short signal on a sharp drop last Friday. On Tuesday it rallied sharply with other resi stocks to unfortunately trigger its stop. Right now it’s looking like it can still continue higher e.g. to 400/404.
SHORTABLE (DOWN-TRENDING):
Please note:
- We list the stocks, and indices (local and overseas) that are in well-established downtrends and that can be sold short (see Glossary for definition), on rallies to resistance.
- Selling short can be done via single stock futures, CFDs, spread trading, and/or put warrants.
- One way of trading these stocks/indices is to sell short rallies to the falling 30-day moving average. The moving average tends to act as loose resistance. Wait for a downward reversal at the moving averages before selling short.
- NOTE 1: ALWAYS USE PROTECTIVE STOPS ON ALL POSITIONS. Selling short is for short-term traders only, and all positions must be monitored closely.
- NOTE 2: The instruments on this list are not automatic shorts, but it is a starting point for looking. Always look at the chart first before making a final decision.
Down-trending Stocks: 30-Day MA:
|
ANGGOLD |
131.2877 |
|
ARCMITTAL |
5.1647 |
|
ASCENDIS |
21.7407 |
|
BASREAD |
0.8903 |
|
BRAIT |
62.2127 |
|
DRDGOLD |
4.1583 |
|
EOH |
123.347 |
|
FAMBRANDS |
124.2593 |
|
GROUP-5 |
19.1113 |
|
HARMONY |
21.876 |
|
IMPLATS |
35.9903 |
|
LIFEHC |
25.7197 |
|
MPACT |
28.6433 |
|
NETCARE |
25.1823 |
|
OCEANA |
93.348 |
|
OMNIA |
137.621 |
|
PNR-FOODS |
135.9383 |
|
RBPLAT |
31.7483 |
|
REMGRO |
211.8623 |
|
SIBANYE |
15.641 |
|
SPAR |
156.3613 |
|
SUNINT |
54.885 |
|
WBHO |
139.731 |
|
WOOLIES |
61.8977 |
Int’l Instruments: 30-Day MA:
|
I-US$INDX |
95.7827 |
|
|
|
|
C-$ZAR-AM |
1306 |
OVERALL SUMMARY
While the markets are powering ahead right now, one has to take a step back and ask where will they be in a week or two time, and then in a months time? I believe we’re in a classic below-off top situation (short-term at least). This is where the so-called smart money is taking profits into strength. Be very careful about buying after an extended up move, it’s a low-odds proposition.
Look for a pullback to be buying again, because after a correction I believe the market will still go higher before any ‘final’ top is in. That applies locally as well as to the S&P 500 index.
Resources stocks have had a big run in recent days. They can still go a bit higher, but a correction there will be very ‘telling’ with regards to whether this is the start of a new med-term rally or not. Some of our resources recommendations have done very well of late, and this is an area to be watching very closely right now. The next week will be very ‘important for garnering more info about its intentions.
Wishing you profitable trading until next time.
Colin Abrams

