Charting Types - Candlesticks
Every trader has their favourite chart type, indicators and timeframes. Here are a some charting types as well as 6 candle stick reversal patterns you should know.
Let’s start with the basics…
How to interpret candlesticks
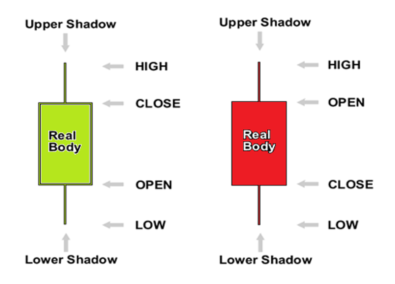
Candlestick charts are a straightforward way to interpret and describe the price action that occurred on an instrument for a given period, highlighting the direction, open, high, low, and close.
If the close is above the open, a positive price action, a green candlestick is drawn. The opposite holds if the close is below the open, negative price action, a red candlestick is drawn.
The “real body” is the green/red section of the candlestick.
The Shadows are the lines above and below the real body which show the high/low range with the top of the upper shadow being the “high” and the bottom of the lower shadow is the “low”.
Long & Short
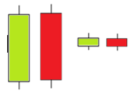
Long & Short candles indicate a strong buying/selling action. The longer the body of the candle, the greater the intensity of the buying/selling pressure.
Long Shadows
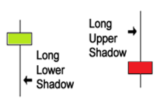
Long Shadows show that the price action occurred well past the open/close. While short shadows indicate that the price action was restricted near the open/close.
Spinning Tops
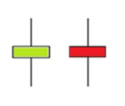
Spinning Tops indicate indecision between buyers and sellers, highlighting there was little movement from open to close, even though the price might have moved significantly during the period.
Marubozu Candles
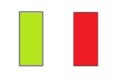
Marubozu candlesticks have no shadow, the high and low are the same as the open and close. A bullish candle (green) contains a long body, where the open price equals the low and the closing price equals the high. This candle indicates buyers were in control for the entire period.
Reversal Candlestick Patterns
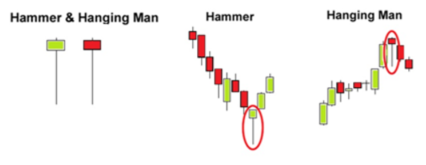
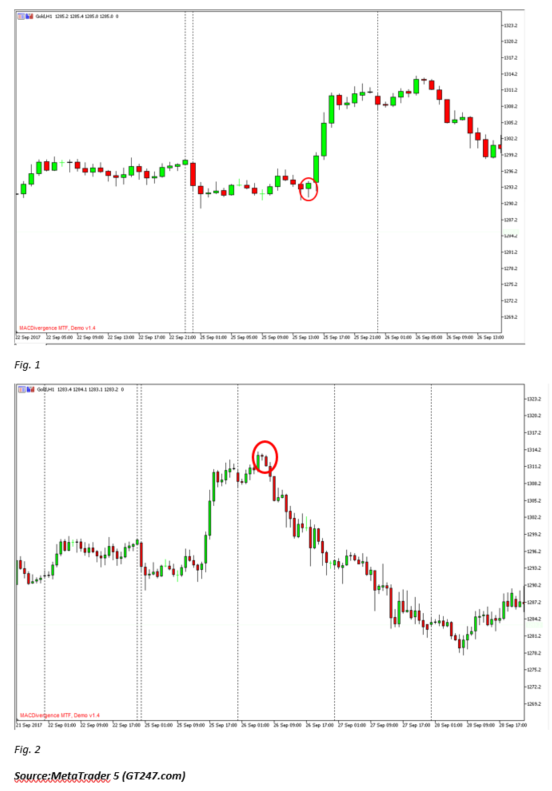
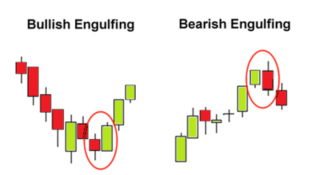
A hammer candle is a bullish reversal pattern that forms during a downtrend highlighting that a bottom or strong support level is near and price should start rising. While the hammer candle is a bullish signal, the hanging man candle is a bearish reversal pattern and can highlight a top or strong resistance level. Both the hammer candle (fig.1) and the hanging man (fig.2) can be seen in the Gold charts below.
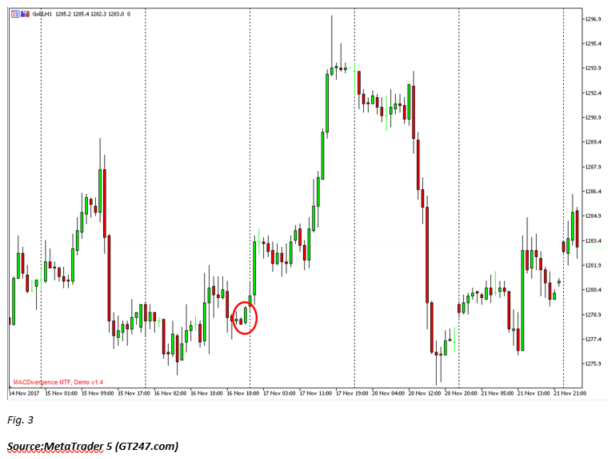
Bullish and Bearish Engulfing
A bullish engulfing pattern is a two-candlestick pattern that signals a strong positive price move may be expected. It happens when a bearish candle is immediately followed by a larger bullish candle. While the bearish engulfing pattern is the opposite of the bullish pattern.
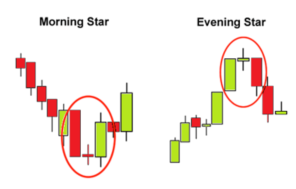
The bullish engulfing pattern (fig.3) can be seen in the Gold chart below.
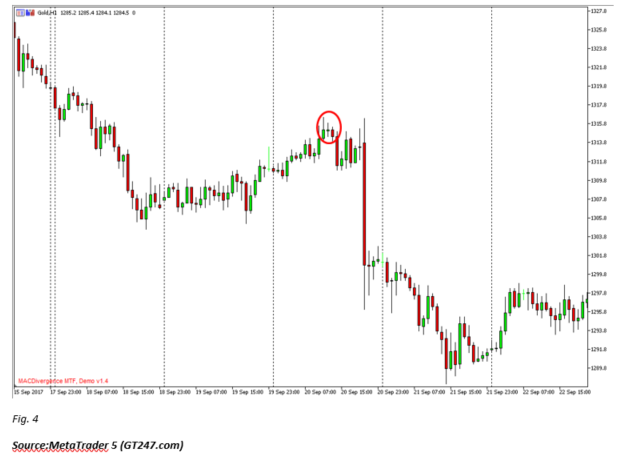
Morning Star / Evening Star
A Morning star pattern normally assist with identifying the end of a trend. This reversal pattern can be recognised by the following characteristics:
- The first candlestick is a bearish candle, which is part of a recent downtrend.
- The second candle has a small body, indicating that there could be some indecision in the market. This candle can be either bullish or bearish.
- The third candle acts as a confirmation of the reversal, as the candle closes above the midpoint of the first candle.
The evening star pattern (fig.4) can be seen in the Gold chart below.