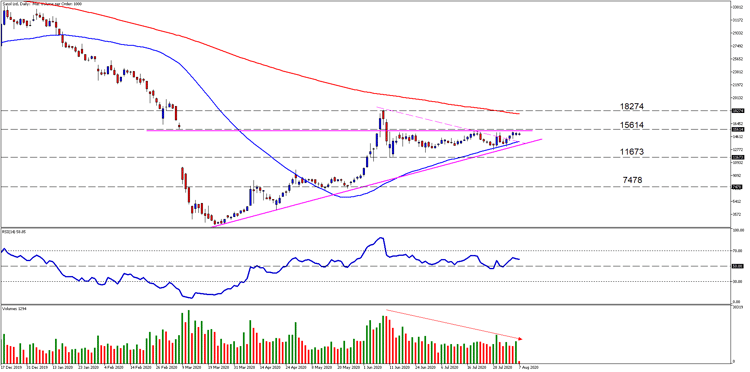
Sasol Limited has seen its fair share of turmoil at the start of the year, the share price has rebounded over 600% from the March low.
The comeback comes as the company restructures its debt and the oil markets regains momentum after oil Futures went negative for the first time.
Read the full note to see charting technicals, resistance and support levels:
Factors to lookout for on Sasol Limited (JSE:SOL)
What’s next for our favourite fuels and chemicals company over the coming week? Well the FY20 Year end results for starters, which is expected on the 17th of August 2020. Market participants are eager to see how the debt reduction programme filters through to the bottom line and if the forward guidance will change. Volatility is expected over this period and depending on the way the market perceives the earnings release, will determine the direction of the share price.
Oil market – Brent crude oil has been a hot topic which has seen Organization of the Petroleum Exporting Countries and allies (OPEC+) raise crude output by 2 million barrels as of the 1st of august 2020. This comes as the coronavirus pandemic puts a damper on global oil demand. The international benchmark for oil, Brent crude might come under pressure in the short term.
Technical insights on Sasol Limited (JSE:SOL)
The price action on Sasol has formed an ascending triangle price pattern which could signal another short term move higher if we see a breakout and close above the 15614c per share level. If we see a breakout, we might assume a possible target price of 18274c per share. But the 200-day Simple Moving Average (SMA redline) might spoil the party and act as major resistance.
At the moment there might be more downside than upside reward in the short term but that could change in an instant if positive fundamental factors play out.
- The 50-day Simple Moving Average (SMA blue line) is acting as a support level to price now and looks pretty thin.
- Downside levels to look out for could be the 11673c per share level if we see a drastic move lower in the price action.
- The Relative Strength Index (RSI) must stay above the midpoint (50) to keep hope alive for higher price levels.
- Volume has also started to move lower, but this could signal a significant move might be on the cards in the near term in either direction.

Chart Source: Sasol Limited Daily Timeframe - GT247 MT5 Trading Platform.
Take note: The outlook and levels might change after Sasol Limited (SOL) FY20 Year end results.
Sources – MetaTrader5, CNBC, OPEC, Anadolu Agency.

Barry Dumas | Market Analyst at GT247.com
Barry has 12 years experience in the financial markets. He enjoys educating clients on trading / investing and providing punchy technical analysis on securities. He currently holds a Wealth Management qualification and is studying towards becoming a Chartered Market Technician® (CMT) designation holder.
Disclaimer:
Any opinions, news, research, reports, analyses, prices, or other information contained within this research is provided by Barry Dumas, Market Analyst at GT247 (Pty) Ltd t/a GT247.com (“GT247.com”) as general market commentary, and does not constitute investment advice for the purposes of the Financial Advisory and Intermediary Services Act, 2002. GT247.com does not warrant the correctness, accuracy, timeliness, reliability or completeness of any information which we receive from third party data providers. You must rely solely upon your own judgment in all aspects of your trading decisions and all trades are made at your own risk. GT247.com and any of its employees will not accept any liability for any direct or indirect loss or damage, including without limitation, any loss of profit, which may arise directly or indirectly from use of or reliance on the market commentary. The content contained within is subject to change at any time without notice.


