


Pairs Trading
- with Trade Specialist Paul Chakaduka
Making my initial strides in this adrenalin paced trading journey, it dawned to me that I needed to have a strategy or else I would be chasing my tail all the time. Navigating my way home on the bumpy potholed roads of Harare, I had a eureka moment and I got researching. All the successful people I researched about had a plan and a strategy, well Chakaduka (that’s me) I had nothing. The trading strategies these gurus used were based on fundamental or technical analysis, concepts I vaguely remembered from university.
There are several trading strategies that one can use based on fundamental or technical analysis. Today I am going to look at Pairs trading strategy, it is a trading strategy that is based on either the price differential (Price of Stock A- Price of Stock B) or price ratio of two instruments (Price of Stock A / Price of Stock B). You would need to be long one Stock and short the other to achieve the desired result.
So, what is Chakaduka smoking again or on about? Let’s try and unpack it a little for you, when looking at pairs trading you need to identify a pair that is correlated (negatively or positively), correlation refers to the relationship or connection of two or more things. For illustration purposes, there is a positive correlation between the share price of an oil producer and the oil price if they are all denominated in USD. If the oil producer is domiciled in a non-dollar territory, there is a negative correlation between the oil price (in USD) and USD exchange rate of that territory.
Our trade idea this week is based on the correlation between MTN and Vodacom. They are the dominant players within the telecoms industry in South Africa and have the lion’s share of the market. There has been a strong positive correlation between the two shares overtime, however the correlation can fall out of kilter due to several factors. We have seen the Vodacom price soar whilst the MTN price has plunged to key support levels in the last month.
From the diagram below, we can see that the ratio between MTN and Vodacom has widened to its widest point since the end of October 2016 (see bottom half of graph in green) where it was trading at below 0.85. From October 2016, the gap narrowed towards the average/mean which is the desired result of the trade and traded above 0.9 for majority of the year. The ratio only began to fall out of kilter again from May 2017 as illustrated below. The gap has widened providing traders with an opportunity to buy MTN and selling Vodacom. If you place the trade and the gap narrows we expect the ratio to move from 0.792 to the mean of 0.912 a 15% move. The gap can narrow through the following:
- MTN remains static and Vodacom plunges.
- MTN rallies and Vodacom plunges.
- MTN rallies and Vodacom remains static.
Within this strategy traders should note the following:
- Ex-dividend dates (if you are short a stock you will need to pay in the dividend).
- Other corporate actions such as share splits share consolidations and rights offers.
- Cash neutrality, we will have the same exposure in the long MTN and the short Vodacom trades, we do this as a precaution to mitigate further risk in the market. So, if we choose to have R15000 nominal exposure on the trade we would buy 132 MTN shares (15000/113) and sell 91 Vodacom shares (15000/164).
- The worst-case scenario, MTN plunges and Vodacom rallies and the ratio widens even further.
MTN vs VODACOM SPREAD
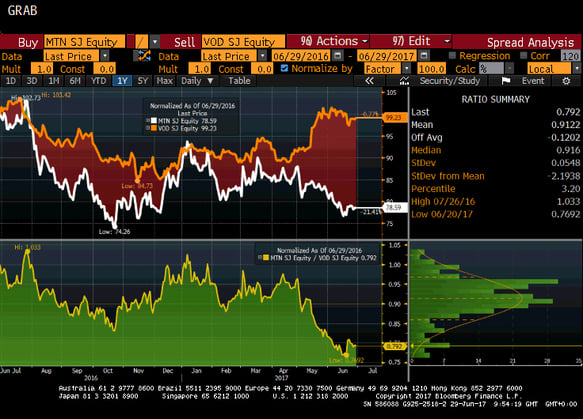
Source: Bloomberg 2017