Oscillators – Relative strength index (RSI)
Many new traders ask me about indicators and how to use them, so I will try and explain it in layman's terms.
Let’s start with oscillators...
What is an oscillator?
An oscillator is a technical tool we as traders use to give us an indication on whether an instrument is over bought or oversold. We use these overbought and oversold extremes to see in which direction the price action will have momentum. Oscillators are typically used in conjunction with other technical analysis indicators to make trading decisions on entering trades. There are a few oscillators like the RSI, ROC and MFI and I will be discussing the Relative Strength Index (RSI) as this is one of the most popular indicators.
The relative strength index (RSI)
The relative strength index (RSI) is a momentum indicator developed by a technical analyst called Welles Wilder and was published in his book, New Concepts in Technical Trading Systems in 1978
Without going to deep into the workings of the RSI, it is primarily used to attempt to identify overbought or oversold conditions when trading an instrument as seen in the Gold chart below.
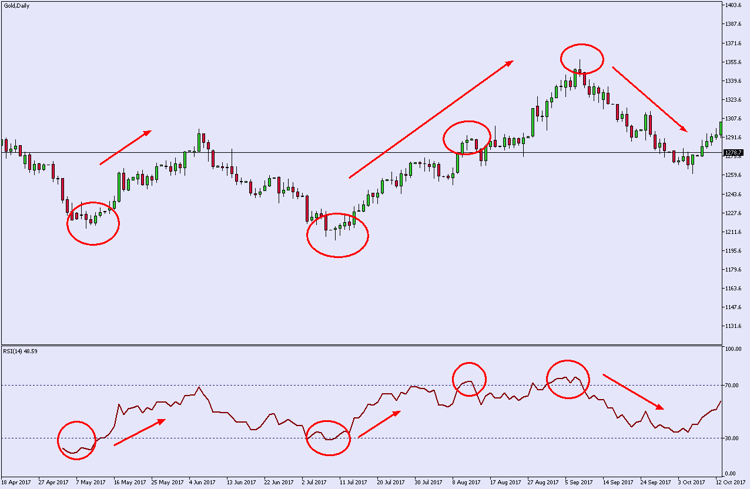
Source: MetaTrader 5 (GT247.com)
Taking a closer look at the RSI
So, when selecting the indicator to your chart you will be prompted to change the parameters of the RSI, I would suggest that new traders keep it at the default setting of 14 as your period and this 14 referred to the last 14 trading days.
You will also see a RSI value of 70 and 30 across your indicator. If the RSI moves above the 70 parameter this is an indication that the instrument is overbought and is set for a trend reversal in the price action. The opposite applies to when the RSI crosses below the 30 parameter.
When these trend reversals happen, we want to get into the market and ride the trend as long as possible and preferably until the next trend reversal happens.
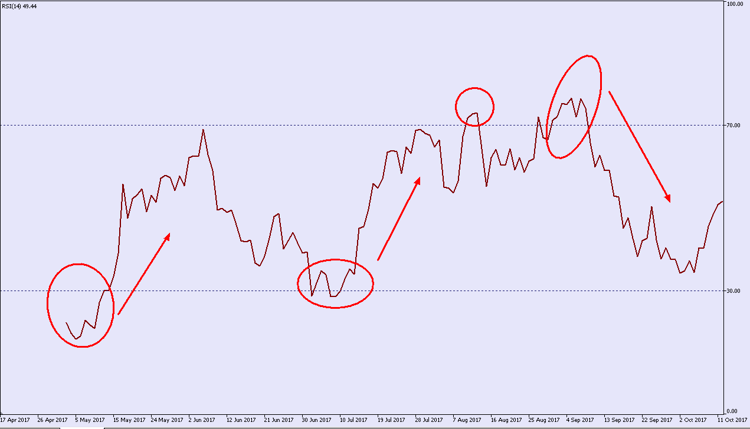
Source: MetaTrader 5 (GT247.com)
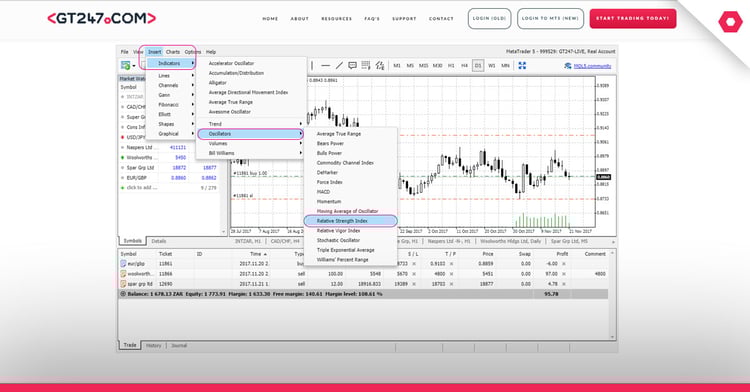
You can apply the RSI to your charts in our MetaTrader 5 platform by selecting "Indicators" -> "Oscillators" -> "Relative Strength Index"