
Moving Averages: Simple, Exponential and Weighted
Many new traders use moving averages, today I will explain the 3 different types, how to use them to determine the current trend, reversals and provide trade signals.
How do the Simple, Exponential and Weighted moving averages differ from each other?
Simple Moving Average (SMA) is an average of the last n prices, where n is the number of periods you want the average of. The advantage of an SMA is that you know exactly what you are getting. The SMA value is the average price for the number of periods in the SMA calculation.
Exponential Moving Average is a weighted average of the last n prices, where the weighting decreases exponentially with each previous price/period. The EMA adapts quicker to price changes than the SMA. For example, when price reverses direction, the EMA will reverse direction quicker than the SMA. This is because the EMA applies more weight to recent prices, and less weight to prices that occurred in the past.
Weighted Moving Average is a weighted average of the last n prices, where the weighting decreases with each previous price. This is calculated by multiplying each one of the closing prices within the considered series, by a certain weight coefficient.
Common values are 10, 20, 50, 100 and 200. For example, traders using a 10-period moving average, will generally have a shorter view on the market while traders using a 200-period moving average will have longer term view on the price.
How moving average’s highlight trends
When the price is above its moving average it shows that the price is trading higher than it has, on average, over the period, confirming an uptrend. When the price crosses above its moving average it shows the price is getting stronger relative to where it was in the past, because the most recent price is now higher than the average.
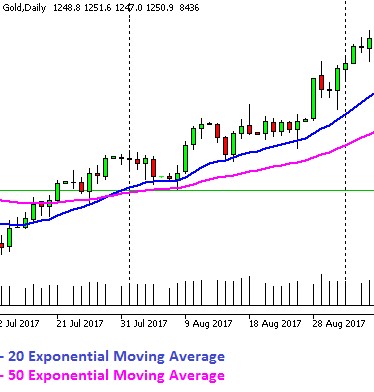
Fig.1 Uptrend (Source:GT247.com)
When the price is below its moving average it shows that the price is trading lower than it has, on average, over the period, confirming a downtrend. If the price crosses below its moving average it shows the price is getting weaker relative to where it was in the past.
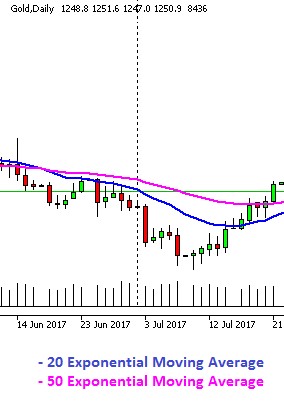
Fig.2 Downtrend (Source:GT247.com)
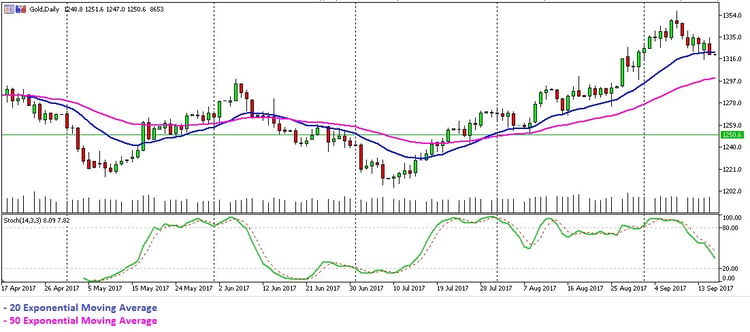
Moving Average Crosses
A short-term and a longer-term moving average, for the example below we will use 20 and 50 periods. When the 20 crosses above the 50 it indicates that short-term price momentum is moving to the upside while when the 20-period moving average crosses below the 50 it indicates that the short-term price momentum is moving to the downside.