Express trade on an hour chart
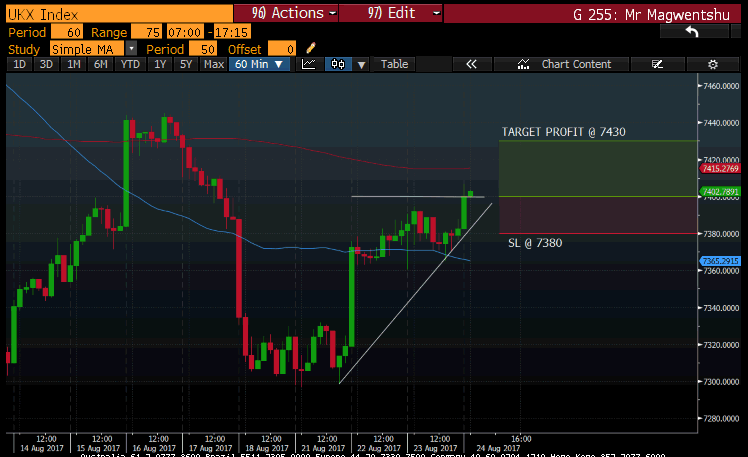
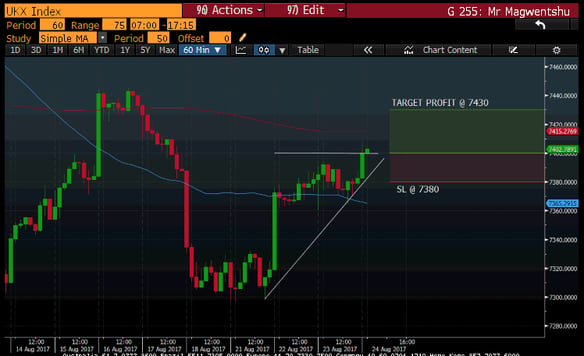
I am having a look at the FTSE 100 index and I notice that on the hourly chart, you will note that the price has gone above the resistance line at 7400 level and it has gone above the line.
Trade summary:
Long FTSE 100 index
Entry: 7400
Stop loss: 7380
Target profit: 7430
Remember... trade responsibly, your capital is at risk and trading can lead to capital losses.
Until next time, I wish you profitable trading.
All charts sourced: Bloomberg
Odwa Magwentshu | Trading Specialist at GT247.com
Disclaimer: Any opinions, news, research, analyses, prices, or other information contained within this research is provided as general market commentary, and does not constitute investment advice. GT247.com will not accept liability for any loss or damage, including without limitation to, any loss of profit, which may arise directly or indirectly from use of or reliance on such information. The content contained within is subject to change at any time without notice, and is provided for the sole purpose of assisting traders to make independent investment decisions.
Want to trade CFD Equities, Forex, Indices & Commodities on the most affordable online South African trading platform?