Full circle for Exxaro Resources Ltd. [JSE:EXX] - Updated
26 July 2017
BOOM! If I have ever seen a trade work out perfectly then this trade on EXXARO Resources Ltd will be it.
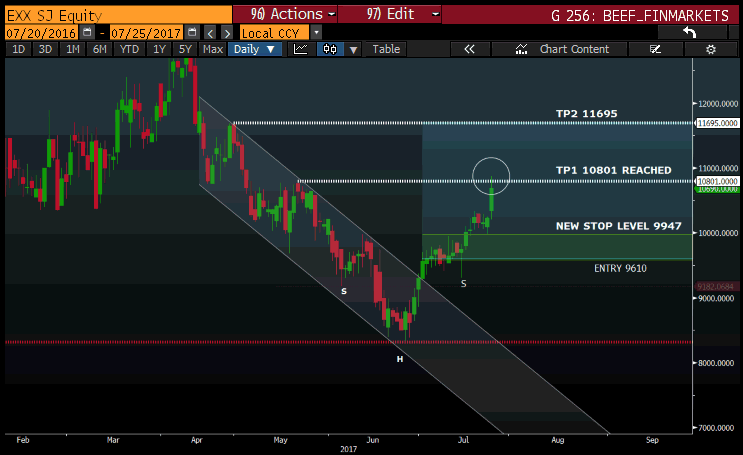
The initial signal to place the trade started with a channel breakout. The trade was placed at entry level 9610c with stop level placed at 8838. The price went sideways for a couple of day and started to form a new pattern, namely an inverse head and shoulders as explained in my update note on EXXARO Resources Ltd posted on 12 Jul 2017. After the right shoulder formed the next line to break was the original resistance line (becoming the neckline in new H&S pattern) at 9947c.
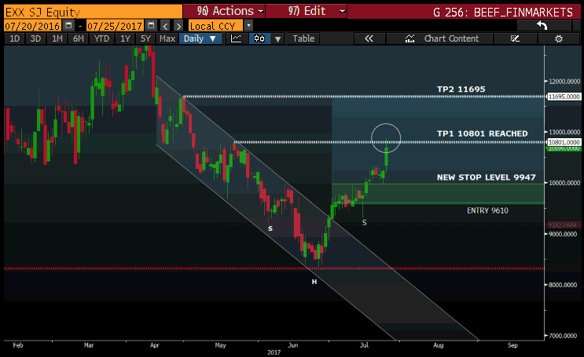
Price broke through the neckline but did come back to re-test the neckline at 9947c, the line held up and the price was off breaking through the first take profit line of 10801c for an 1191-point profit which comes to 12.39%.
The trade worked out perfectly and I am gladly taking the profits and moving on to the next one and for clients still in the trade just manage your stop levels as shown in graph below to lock in profits as the price moves up to TP2 11695c
Source: Bloomberg
Re-cap Exxaro Resources Ltd. [JSE:EXX]: 12 July 2017
An update on our technical trade note dated 5th July for Exxaro Resources Ltd...
The Trade:
Direction: Buy (long)
Entry: 9610c
Stop: Loss: 9182 (updated from 8729)
Take Profit: 10801c
The Trade re-cap:
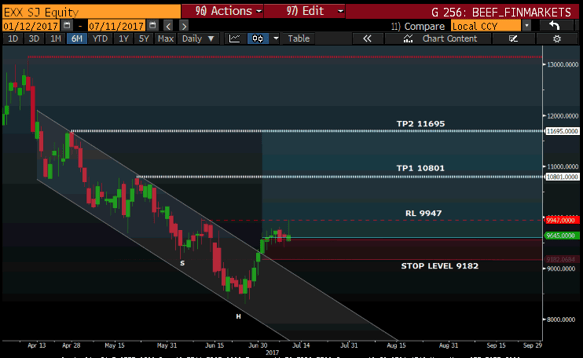
A week has passed since we placed the Exxaro Resources Ltd (EXX) trade at 9610c on the 5th of June. The price action went sideways for 3 trading days and started to move lower reaching a low of 9402c where it found some support and started to move higher from there.
Yesterday the price shot up to 9947c where it found new longer-term resistance and retraced back to 9786c, closing the day at 9700. The original Stop loss level of 8729c has been moved up to 9182c in anticipation of a head and shoulder pattern forming on the daily time frame with a target of 10801c.

Source - Bloomberg
Always remember to apply your risk management measures before placing your trades as this will keep you trading in the markets.
Disclaimer: Any opinions, news, research, analyses, prices, or other information contained within this research is provided as general market commentary, and does not constitute investment advice. GT247.com will not accept liability for any loss or damage, including without limitation to, any loss of profit, which may arise directly or indirectly from use of or reliance on such information. The content contained within is subject to change at any time without notice, and is provided for the sole purpose of assisting traders to make independent investment decisions.
GT247.com: +27 87 940 6101
IT support & help desk: +27 87 940 6107
Client relations (new accounts): +27 87 940 6106
Sales: +27 87 940 6108


