


27 July 2017
Dollar to join the 'Darkside'
TECHNICAL TAKE - UPDATE
Last night we saw the dollar index weaken further during the FOMC statement, as the Fed left the Fed Funds rate unchanged at 1.25%. The major contributor that influenced the move was the hint that the Fed would start reducing the $4.5 Trillion balance-sheet ‘relatively soon’. Traders are looking to hear an announcement in September.
(Dollar Index Chart)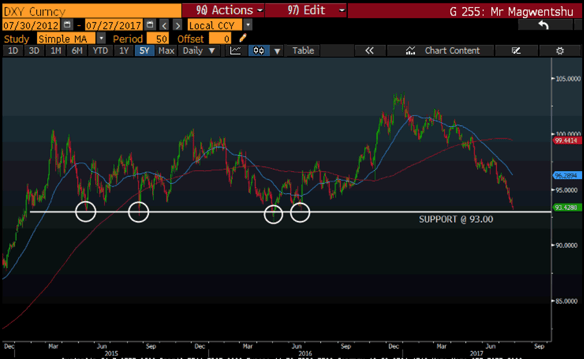
Source: Bloomberg
If you look at the image above, you will find the Dollar Index has been finding support at the 93.00 level, twice in 2015 and twice again in 2016. At the rate events are unfolding in the US, the index is more likely to break through the support level. Gold has reacted to the movement and has gone above a weak resistance level at $1260/oz.
Do keep in mind that today at 2:30pm there is some news that will be released which is the ‘unemployment claims’ and the month to month ‘core durable goods orders’.
The pair that has been making strides on the weakening dollar is the EURUSD pair which has broken out of a channel which the pair has been trading in since the beginning of 2015.
(EUR/USD Chart)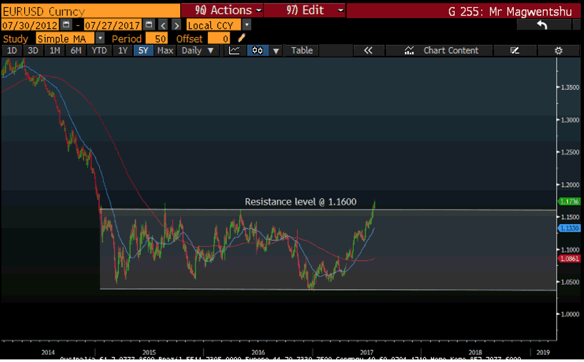
Source: Bloomberg
17 July 2017
Dollar to join the 'Darkside'
TECHNICAL TAKE - SUMMARY ->
USD/JPY currency pair
Direction: Sell (Short)
Entry: 112.00
Stop: Loss: 114.50
Take Profit 1: 108.80
Take Profit 2: 105.30
The US dollar continues to weaken and this can be attributed to the recent email scandal, which intensified investigation into President Trump’s election victory and the involvement of Russia. Senior Democrats are looking to further investigate the digital activities of the Russians.
The sentiment of a weaker dollar will be confirmed with the completion of a death cross, which is looking to form on the USDJPY daily chart. The death cross is when the short term, 50-day exponential moving average crosses below the long term, 200-day exponential moving average. The formation of the death cross is usually a bearish signal.
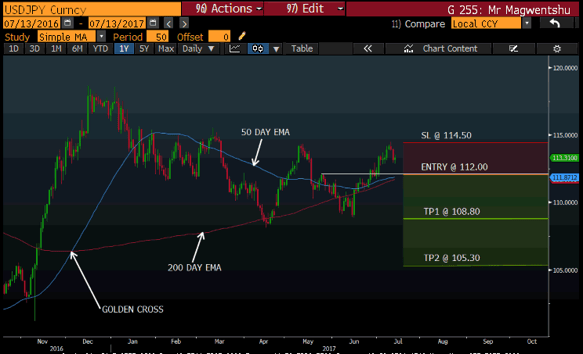
chart source: Bloomberg
The chart above shows that the cross almost triggered mid-June and since then the two averages have been moving side by side. After the CPI and Retail sales results were released on Friday, which came out worse than expected, the death cross still should complete in the next few days.
The opposite happened last year after the USD elections (on the same graph), which is known as the ‘Golden cross’. This is when the 50 day EMA crossed above the 200 day EMA.
Remember... trade responsibly, your capital is at risk and trading can lead to capital losses.
Until next time, I wish you profitable trading.