Indicator – Copper (HG) as leading indicator for Glencore PLC (GLN)
Let’s have a look at the aged old question by traders starting out in the market, when will a stock start to rise? Or even fall? Well there are a number of factors that influence stock prices to go up and down during a day but let’s just step aside from the noise for a moment and look at what will give us an indication of whether a stock will rise or fall namely leading indicators.
Copper is probably the most reliable leading indicator for resources stocks on our market and I will be looking at Copper (HG) leading relation to Glencore PLC (GLN).
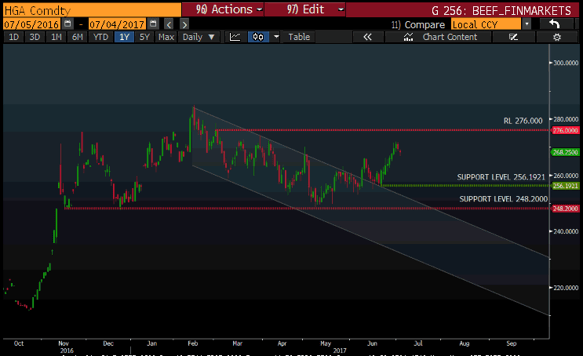
Copper (HG):
Copper has been in a downward channel from the second week in February at a high of $2.787/ pound and broke out of the channel on 8 Jun at $2.599/pound. This breakout was highly anticipated as this would give a significant signal for resource stocks to start moving higher. The Copper price came down to retest the channel’s resistance line which in turn became support for the price to lift off, as it did on 21 June. The price of copper increased from $2.533/pound to a high of $2.694/pound by 30 Jun and started to retrace to where it is today at $2.674/pound.
 Source: Bloomberg 2017
Glencore (GLN):
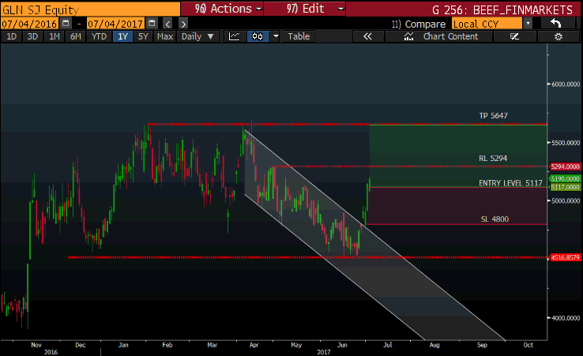
Glencore has also been in a downward channel as it was most probably following the leading indication of the Copper price. The downward channel started from around the second week in April from a High of 5647c to a low of 4521c testing support at that level on the 26th of June but subsequently started to move higher as Copper gained momentum and broke out of the channel on the 3rd of June.
 Source: Bloomberg 2017
Conclusion and outlook:
Copper should retrace as traders take profits followed by a move higher to test resistance levels around $2.760/ pound. Outlook for Glencore is that the price will gain momentum for now and retest resistance levels at 5294c and the previous high of 5647c. A subsequent break from this level, supported by higher copper prices could see Glencore move to 6500c over the longer term.
Trade:
When entering the Glencore trade at the current level of 5117c, a stop loss level to consider will be 4800c, and our take profit target is 5647c. Remember to look out for resistance around the 5294c level and if this resistance level breaks, you should adjust your stop loss level upwards to your entry price or just below to minimize your risk as the price moves in your favour.
Always remember to apply your risk management measures before placing your trades as this will keep you trading in the markets.
Barry Dumas | Trading Specialist at GT247.com
Disclaimer: Any opinions, news, research, analyses, prices, or other information contained within this research is provided as general market commentary, and does not constitute investment advice. GT247.com will not accept liability for any loss or damage, including without limitation to, any loss of profit, which may arise directly or indirectly from use of or reliance on such information. The content contained within is subject to change at any time without notice, and is provided for the sole purpose of assisting traders to make independent investment decisions.
Want to trade CFD Equities, Forex, Indices & Commodities on the most affordable online South African trading platform?
GT247.com: +27 87 940 6101
IT support & help desk: +27 87 940 6107
Client relations (new accounts): +27 87 940 6106
Sales: +27 87 940 6108