Short the Nikkei
Trade summary:
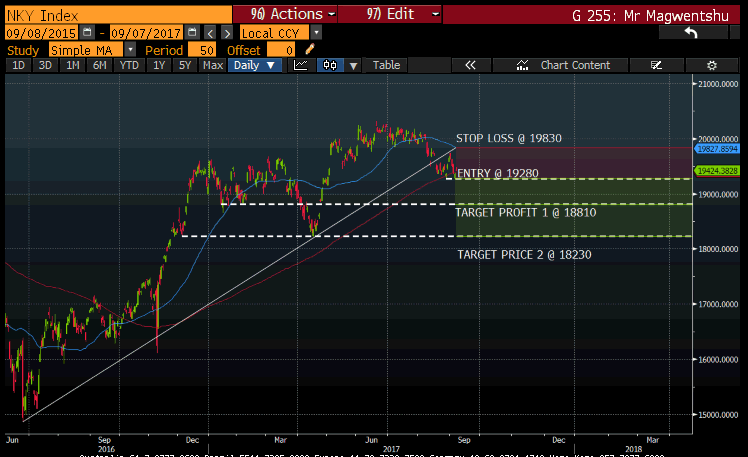
Stop loss 19830
Entry 19280
Target price 1 18810
Target price 2 18230
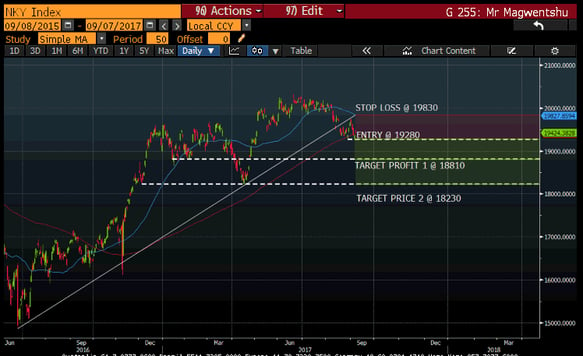
The Nikkei index has broken below the highlighted trend line and has gone to retest this trend line and it seems as if the Nikkei will continue to weaken during the day, if it goes below 19280 level, I see a great opportunity to short the trade.
Short Standard Bank
Trade summary:
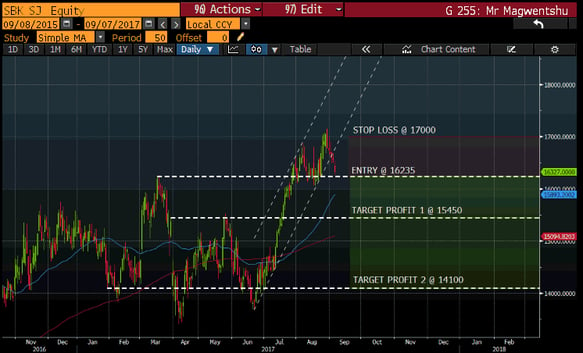
Stop loss 17000c
Entry 16235c
Target price 1 15450c
Target price 2 14100c
Towards the end of June until mid-August Standard Bank has had a positive rally and on Tuesday the price closed outside of the channel as depicted above. This move outside the channel triggered a negative movement for the share price. I am expecting further downward pressure and I anticipate that the share price should trend lower and to reach the levels stipulated above.
Long DRD
Trade summary:
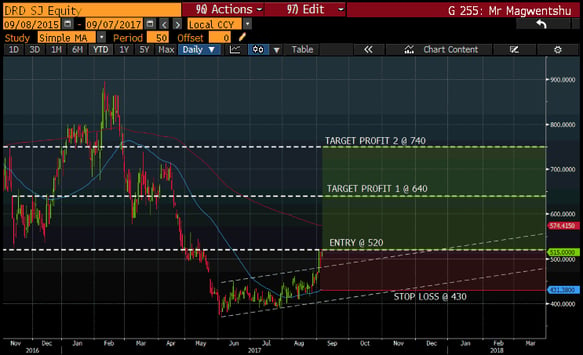
Stop loss 430
Entry 520
Target price 1 640
Target price 2 740
I have seen the DRD share price consolidate from the month of June to August but at a slightly inclining trend. On Monday it broke out the channel to test a resistance level @520c. There is some great upside for this trade if it holds above 520c, if the Gold price continues to appreciate as seen in recent weeks, I anticipate the share price to move towards 640c first before charging towards 740c.
Short Exxaro
Trade summary:
Stop loss 13285c
Entry 12790c
Target price 1 12104c
Target price 2 11377c
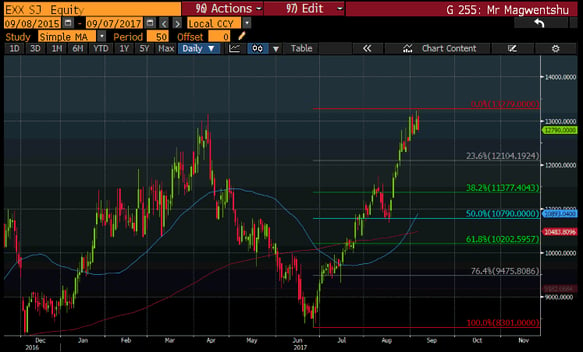
Exxaro has be in a rally since the end of June this year and seems to be currently trading around the resistance level that it reached in mid-April and I anticipate that there will be a retracement from these levels to the 23.6% Fibonacci level (12104c) from the peak of 13279c and could continue to weaken and reach the 38.2% Fibonacci level (11377c).
Short First Rand
Trade summary:
Stop loss 5770c
Entry 5421c
Target price 1 5211c
Target price 2 5042c
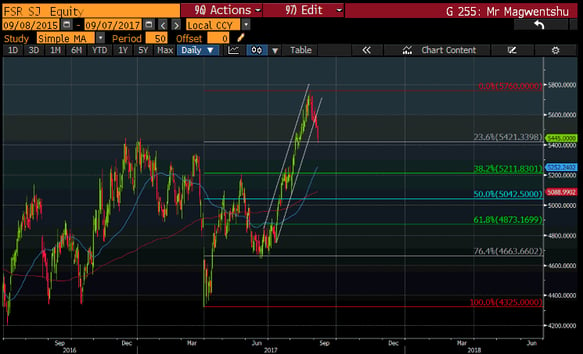
A retracement has started on First Rand and on Monday (4 September 2017) we found the price close outside the channel and yesterday it tested the first Fibonacci level at 23.6% (5421c). Should it continue to decline in value, it should go to 5211c and possibly as far as the 50% Fibonacci level (5042c).
Remember... trade responsibly, your capital is at risk and trading can lead to capital losses.
Until next time, I wish you profitable trading.
All charts sourced: Bloomberg

Disclaimer: Any opinions, news, research, analyses, prices, or other information contained within this research is provided as general market commentary, and does not constitute investment advice. GT247.com will not accept liability for any loss or damage, including without limitation to, any loss of profit, which may arise directly or indirectly from use of or reliance on such information. The content contained within is subject to change at any time without notice, and is provided for the sole purpose of assisting traders to make independent investment decisions.


