What are chart patterns:
Due to supply and demand, fear and greed in the markets certain price action patterns will form and there are a few them and they can be found in all markets.
Why you must look for chart patterns:
Charting patterns will give you an entry point and a take profit level, your stop level should be placed at your risk level like your 2% rule for instance. What more do you need to start to rake in those profits and start your way to becoming a profitable trader. And to make things even better is that there are inverse versions of these patterns as well so you can make profits if the market goes up or down, you will just have to identify the patterns.
And this what they look like:
These patterns are also not exclusive to the Forex market but can be found in all markets from individual stocks, commodities to whole indices.
Let's get started!
1. Inverse Head and Shoulders:
- This is the exact opposite of the classic head and shoulders pattern
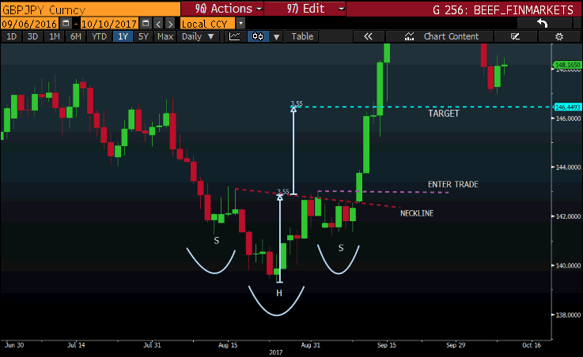
- It signals a reversal in trend so when there is a down trend like in the GBP/JPY chart the price will make lower lows forming the left shoulder and head, price will reverse forming the head and right shoulder and start to make higher highs.
- Price will break neckline confirming the pattern is intact.
- Entry shown on chart below and the target distance is the same distance taken from the tip of the head to the neckline projected upwards.

Source - Bloomberg
2. Channel:
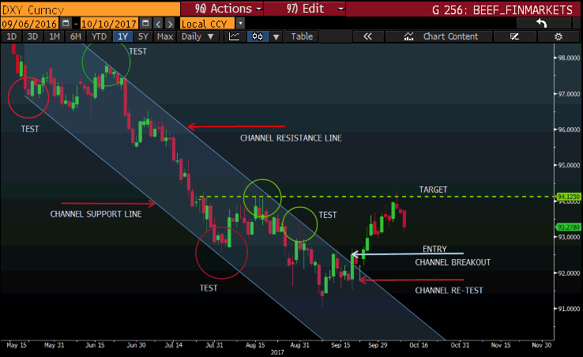
- A channel is in a sense a continuation pattern that slops either up or down or even sideways and is bound by a support and resistance line.
- The price will test these support and resistance lines until the price breaks out of this channel.
- If the channel slopes down it is considered bearish until the price action breaks out from this channel to the upside signifying that the trend is reversing.
- If the channel moves higher it is considered a bullish trend until the price action breaks out from this channel to the downside signifying that the trend is reversing.
- If the channel moves sideways it is consolidating until the price action breaks out either to the top or bottom.
- Entry shown on the chart where price breaks out of the channel and your target price can be the following resistance area depicted with the green dotted line or the width of the channel projected upwards from the breakout point.

Source - Bloomberg
3. The Rounding Bottom:
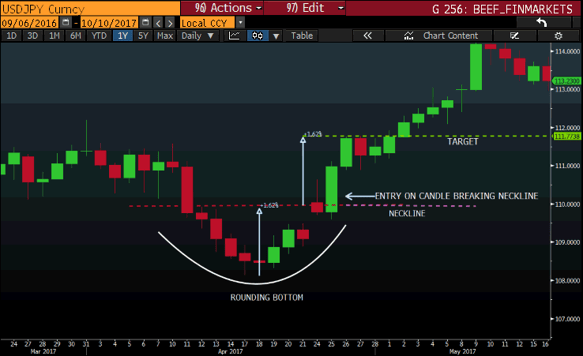
- The rounding bottom is a reversal pattern
- The pattern can be seen as a consolidation period before the price action turns from a bearish sentiment to a bullish outlook.
- The pattern is best viewed over longer periods of time/ timeframes and the daily and weekly time frame seems to be the best view point for me.
- Entry shown in chart and the target will be the distance from the point of the rounding bottom to the neckline projected upwards.

Source - Bloomberg
Disclaimer:
Any opinions, news, research, reports, analyses, prices, or other information contained within this research is provided by Barry Dumas, Market Analyst at GT247 (Pty) Ltd t/a GT247.com (“GT247.com”) as general market commentary, and does not constitute investment advice for the purposes of the Financial Advisory and Intermediary Services Act, 2002. GT247.com does not warrant the correctness, accuracy, timeliness, reliability or completeness of any information which we receive from third party data providers. You must rely solely upon your own judgment in all aspects of your trading decisions and all trades are made at your own risk. GT247.com and any of its employees will not accept any liability for any direct or indirect loss or damage, including without limitation, any loss of profit, which may arise directly or indirectly from use of or reliance on the market commentary. The content contained within is subject to change at any time without notice.


